The United States Mint maintained a healthy pace of producing coins for circulation in November, making more than one billion of them for a sixth month in a row.
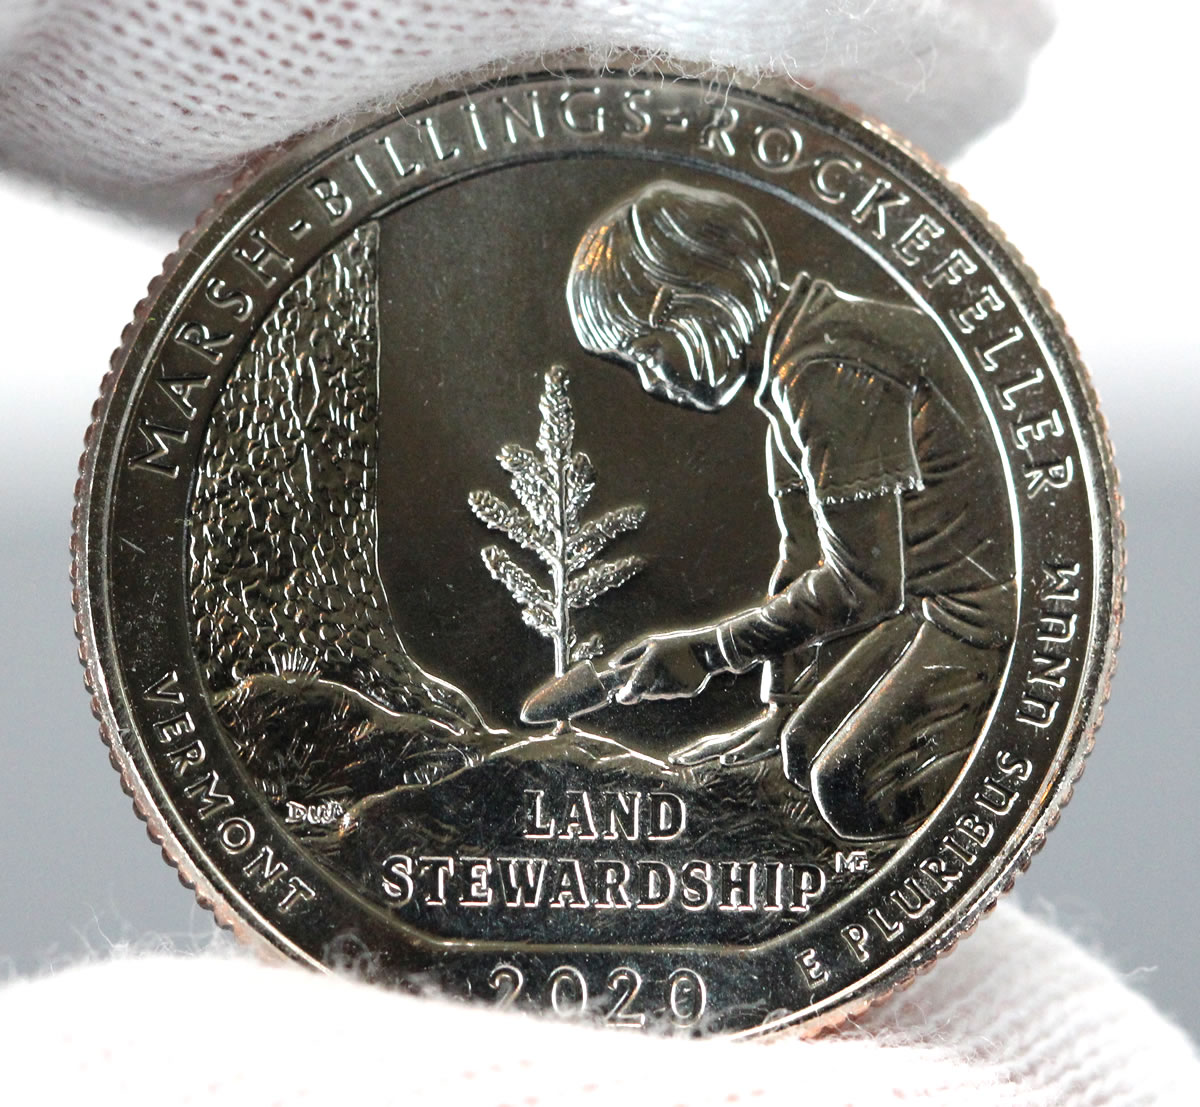
The latest round of U.S. Mint figures also reveal mintages for Vermont’s Marsh-Billings-Rockefeller quarter, the fourth of this year’s five quarters with unique designs.
In headline monthly comparisons, the U.S. Mint manufactured over 1.16 billion coins for circulation, down 17.1% from the amount produced in October but 29.7% higher than the number minted in November 2019.
Here’s how the month compares against others in the past year:
November 2019 to November 2020 Circulating Coin Production
| Month | Mintages | Rank |
| November 2020 | 1,165.10 M | 7 |
| October 2020 | 1,404.69 M | 5 |
| September 2020 | 1,422.59 M | 4 |
| August 2020 | 1,657.06 M | 2 |
| July 2020 | 1,697.74 M | 1 |
| June 2020 | 1,596.48 M | 3 |
| May 2020 | 904.12 M | 9 |
| April 2020 | 801.84 M | 12 |
| March 2020 | 898.86 M | 10 |
| February 2020 | 1,094.30 M | 8 |
| January 2020 | 1,228.08 M | 6 |
| December 2019 | 400.88 M | 13 |
| November 2019 | 898.38 M | 11 |
The Federal Reserve orders more 1-cent coins than any other denomination despite data that shows it costs the U.S. Mint 1.99 cents to make and distribute each one. The Mint produced 560.8 million Lincoln cents last month, representing 48.1% of the circulating-quality coins produced in November.
Month-Over-Month
In month-over month comparisons for coins used daily by Americans, production totals in November declined:
- 18.8% Lincoln cents,
- 38% Jefferson nickels,
- 1.1% Roosevelt dimes, and
- 15.1% America the Beautiful quarter dollars.
Native American $1 Coins and Kennedy half-dollars are no longer ordered by Federal Reserve Banks but they are still made in circulating quality for coin collectors. Usually in January, the U.S. Mint strikes both coins to the expected amounts needed for the entire year. That wasn’t the case for halves — more were produced in February, in July, and again in November.
In February, mintages of Philadelphia Mint-struck Kennedy half-dollars rose by 1.8 million after none were reported out of the plant in January. Then in July, the Philadelphia Mint made another half million for a new total of 2.3 million. The Denver Mint produced 1.8 million halves in January and then struck another 1.6 million in November for a total of 3.4 million. Together, both plants minted 5.7 million halves. For reference, last year’s half-dollar ended with equal splits of 1.7 million for Denver and Philadelphia for a combined 3.4 million.
Published mintages of the Native American dollar remained unchanged — 1.26 million from Denver and 1.4 million from Philadelphia for a combined 2.66 million coins. Last year’s issue had splits of 1.54 million for Denver and 1.4 million for Philadelphia for a combined 2.94 million coins.
Here’s a summary of all circulating-quality coins produced last month:
US Mint Circulating Coin Production in November 2020
| Denomination | Denver | Philadelphia | Total |
| Lincoln Cents | 295,200,000 | 265,600,000 | 560,800,000 |
| Jefferson Nickels | 56,160,000 | 55,440,000 | 111,600,000 |
| Roosevelt Dimes | 135,000,000 | 130,500,000 | 265,500,000 |
| ATB Quarters | 115,200,000 | 110,400,000 | 225,600,000 |
| Kennedy Half Dollars | 1,600,000 | 0 | 1,600,000 |
| Native American $1s | 0 | 0 | 0 |
| Total | 603,160,000 | 561,940,000 | 1,165,100,000 |
U.S. Mint plants in Denver and Philadelphia manufacture all of America’s coins for commerce. In November, the Denver Mint struck 603.16 million coins and the Philadelphia Mint made 561.94 million coins for the combined 1,165,100,000 coins.
YTD Totals
Year-to-date, the Denver Mint produced 7,159,660,000 coins and the Philadelphia Mint struck 6,711,220,000 coins for 13,870,880,000 coins in total — 20.2% more than the 11,541,354,400 coins minted through the first ten months of 2019.
This next table lists 2020 coin production totals by denomination and by U.S. Mint facility:
YTD 2020 Circulating Coin Production by Denomination
| 1 ¢ | 5 ¢ | 10 ¢ | 25 ¢ | 50 ¢ | N.A. $1 | Total: | |
|---|---|---|---|---|---|---|---|
| Denver | 3790.8M | 770.4M | 1294M | 1299.8M | 3.4M | 1.26M | 7159.66M |
| Philadelphia | 3370M | 726M | 1247.5M | 1364M | 2.3M | 1.4M | 6711.22M |
| Total | 7160.8M | 1496.4M | 2541.5M | 2663.8M | 5.7M | 2.66M | 13870.88M |
The 2020 monthly average of roughly 1.26 billion coins tracks over 12 months to more than 15.1 billion coins. The Mint made over 11.9 billion coins for circulation in 2019.
Mintages by Unique Design
The U.S. Mint released six annually issued coins with one-year-only designs. They included:
- the 2020 National Park of American Samoa quarter,
- the 2020 Native American dollars,
- the 2020 Weir Farm National Historic Site quarter for Connecticut,
- the 2020 Salt River Bay National Historical Park and Ecological Preserve quarter for U.S. Virgin Islands,
- the 2020 Marsh-Billings-Rockefeller National Historical Park quarter for Vermont, and
- the 2020 Tallgrass Prairie National Preserve quarter for Kansas.
The following table offers a breakdown of this year’s mintages by coin design:
2020 Circulating Coin Production by Design
| Denver | Philadelphia | Total | |
| Lincoln Cents | 3,790,800,000 | 3,370,000,000 | 7,160,800,000 |
| Jefferson Nickels | 770,400,000 | 726,000,000 | 1,496,400,000 |
| Roosevelt Dimes | 1,294,000,000 | 1,247,500,000 | 2,541,500,000 |
| National Park of American Samoa Quarter | 212,200,000 | 286,000,000 | 498,200,000 |
| Weir Farm National Historic Site Quarter (Connecticut) | 155,000,000 | 125,600,000 | 280,600,000 |
| Salt River Bay National Historical Park and Ecological Preserve Quarter (U.S. Virgin Islands) | 515,000,000 | 580,200,000 | 1,095,200,000 |
| Marsh-Billings-Rockefeller National Historical Park Quarter (Vermont) | 345,800,000 | 304,600,000 | 650,400,000 |
| Tallgrass Prairie National Preserve Quarter (Kansas) | 0 | 0 | 0 |
| Kennedy Half-Dollars | 3,400,000 | 2,300,000 | 5,700,000 |
| Native American $1 Coins | 1,260,000 | 1,400,000 | 2,660,000 |
| Total | 7,087,860,000 | 6,643,600,000 | 13,731,460,000 |
In subtracting the Mint’s totals by coin design from their overall production figures by denomination, there is one difference — mintages of quarters are higher by 139.4 million. These are likely a portion of Kansas’ Tallgrass Prairie National Preserve quarters.


