Last week, the United States Mint introduced two product lines for collectors: Edith Kanakaʻole quarters and proof American Gold Eagles in four sizes and a set. New U.S. Mint sales figures show how many of these products were sold in their first few days.

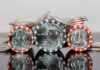
The Edith Kanakaʻole quarter is the seventh issue from the Mint’s four-year series of coins honoring the achievements of American women. It was released on March 27 in rolls and bags, with prices ranging from $40 to $60.
Across the roll and bag products, Mint figures show combined sales of 2,328,400 coins, already making it the second-highest selling quarter in the series. For comparison:
- 2023 Bessie Coleman quarter debuted with sales of 2,745,380, now at 2,834,760
- 2022 Anna May Wong quarter started with sales of 1,740,120, now at 1,760,720
- 2022 Nina Otero-Warren quarter opened with sales of 1,720,160, now at 1,757,420
- 2022 Wilma Mankiller quarter debuted with sales of 1,738,440, now at 1,753,640
- 2022 Dr. Sally Ride quarters started with sales of 1,755,480, now at 1,756,780
- 2022 Maya Angelou quarters opened with sales of 1,753,280, now at 1,757,420
Each of the new Edith Kanakaʻole quarter products was among the Mint’s best weekly sellers. The three-roll set, which sold out within a few hours of release, led all products.
2023-W Proof Gold Eagle Sales
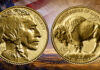
Released March 30 at prices ranging from $330 to $5,332.50, the new collection of proof Gold Eagles saw a combined 36,274 coins ordered within four days. In contrast, last year’s proof Gold Eagle products launched at the same prices and recorded combined sales of 54,222 coins during the same period.
Typically, the four-coin set sells the most units early on, but this year, the trend was different. The smallest coin sold the most initially, followed by the set.
To offer a better understanding of their sales performance, here’s a breakdown of their sales through Sunday by product option:
| Product Option | Product Limit | Price | Mintage Limit | Reported Sales |
| 2023 $50 American Eagle Gold Proof Coin (1 oz.) | 9,500 | $2,850.00 | 22,500 | 4,099 |
| 2023 $25 American Eagle Gold Proof Coin (1/2 oz.) | 3,000 | $1,450.00 | 16,000 | 1,380 |
| 2023 $10 American Eagle Gold Proof Coin (1/4 oz.) | 6,000 | $752.50 | 19,000 | 4,065 |
| 2023 $5 American Eagle Gold Proof Coin (1/10 oz.) | 18,000 | $330.00 | 31,000 | 5,642 |
| 2023 American Eagle Gold Proof Coins (Four-Coin Set) | 13,000 | $5,332.50 | N/A | 5,272 |
U.S. Mint Top Sellers
Here’s the listing of the U.S. Mint’s most popular numismatic products for the week ending April 2:
- 2023-P, D & S Edith Kanakaʻole Quarters Three-Roll Set (+12,566)
- 2023-W $5 Proof Gold Eagle (+5,642)
- 202-W Proof Gold Eagle Four-Coin Set (+5,272)
- 2023-P&D Edith Kanakaʻole Quarters Two-Roll Set (+4,391)
- 2023-W $50 Proof Gold Eagle (+4,099)
- 2023-W $10 Proof Gold Eagle (+4,065)
- 2023-P Edith Kanakaʻole Quarters in 100-Coin Bags (+2,445)
- 2023-D Edith Kanakaʻole Quarters in 100-Coin Bags (+2,247)
- 2023 American Women Quarters Proof Set (+1,869 to 42,229)
- 2023-W Proof Silver Eagle (+1,450 to 342,648)
- 2023-W $25 Proof Gold Eagle (+1,380)
In its latest report, the U.S. Mint published sales data for 308 numismatic products. Eighty-five outperformed their prior weekly gains against 43 previously. Not counting the new proof set, 2 products increased by more than 1,000 units compared to 0 previously.
Additionally, there was 1 product with negative weekly sales, compared to 8 in the previous report. One-hundred coin bags of 2022-D Dr. Sally Ride quarters slipped by 2 units.
US Mint Sales: Numismatic Products
Below are tables showing the latest available sales for U.S. Mint numismatic products. The sales period covers from March 27 to April 2. Products with an asterisk (*) are no longer available or had no reported sales.
Armed Forces Silver Medals | ||||
| Old Sales | Latest Sales | Gain/ Loss | % Increase | |
| U.S. Army 2.5 Ounce Silver Medal | 9,788 | 9,925 | 137 | 1.40% |
| U.S. Marine Corps 2.5 Ounce Silver Medal | 9,567 | 9,567 | – | – |
| U.S. Navy 2.5 Ounce Silver Medal | 9,978 | 9,978 | – | – |
| U.S. Coast Guard 2.5 Ounce Silver Medal | 9,922 | 9,922 | – | – |
| U.S. Air Force 2.5 Ounce Silver Medal | 9,953 | 9,953 | – | – |
| U.S. Coast Guard 1 Ounce Silver Medal | 15,243 | 15,281 | 38 | 0.25% |
| U.S. Air Force 1 Ounce Silver Medal | 16,276 | 16,352 | 76 | 0.47% |
American Liberty Products | ||||
| Old Sales | Latest Sales | Gain/ Loss | % Increase | |
| 2022-P American Liberty Silver Medal | 66,739 | 67,062 | 323 | 0.48% |
| 2021-W $100 American Liberty Gold Coin | 12,470 | 12,470 | – | – |
| 2019-W $100 American Liberty Gold Coin | 24,609 | 24,609 | – | – |
| 2019-P American Liberty Silver Medal | 44,928 | 44,928 | – | – |
| 2018-W $10 American Liberty Gold Coin | 55,025 | 55,118 | 93 | 0.17% |
| 2017 American Liberty Silver Four-Medal Set* | 32,647 | 32,647 | – | – |
| 2017-S Enhanced Uncirculated Coin Set* | 210,419 | 210,419 | – | – |
| 2017-W $100 American Liberty Gold Coin | 38,428 | 38,456 | 28 | 0.07% |
| 2017-P Proof American Liberty Silver Medal* | 55,187 | 55,187 | – | – |
Clad Proof Sets | ||||
| Old Sales | Latest Sales | Gain/ Loss | % Increase | |
| 2022 Proof Set | 399,387 | 399,557 | 170 | 0.04% |
| 2021 Proof Set | 511,268 | 511,288 | 20 | 0.00% |
| 2020 Proof Set* | 464,658 | 464,658 | – | – |
| 2019 Proof Set* | 601,327 | 601,327 | – | – |
| 2018 Proof Set* | 517,081 | 517,081 | – | – |
| 2017 Proof Set* | 568,678 | 568,678 | – | – |
| 2022 American Innovation Dollars Proof Set | 74,276 | 74,477 | 201 | 0.27% |
| 2021 American Innovation Dollars Proof Set | 83,232 | 83,311 | 79 | 0.09% |
| 2020 American Innovation Dollars Proof Set | 107,052 | 107,052 | – | – |
| 2019 American Innovation Dollars Proof Set | 145,159 | 145,211 | 52 | 0.04% |
| 2023 American Women Quarters Proof Set | 40,360 | 42,229 | 1,869 | 4.63% |
| 2022 American Women Quarters Proof Set* | 42,616 | 42,616 | – | – |
| 2020 America the Beautiful Quarters Proof Set* | 64,242 | 64,242 | – | – |
| 2019 America the Beautiful Quarters Proof Set | 82,329 | 82,380 | 51 | 0.06% |
| 2018 America the Beautiful Quarters Proof Set* | 86,697 | 86,697 | – | – |
Silver Proof Sets | ||||
| Old Sales | Latest Sales | Gain/ Loss | % Increase | |
| 2022 Silver Proof Set | 239,686 | 239,972 | 286 | 0.12% |
| 2021 Silver Proof Set | 299,449 | 299,538 | 89 | 0.03% |
| 2020 Silver Proof Set* | 313,183 | 313,183 | – | – |
| 2019 Silver Proof Set* | 412,708 | 412,708 | – | – |
| 2018 Silver Proof Set* | 332,274 | 332,274 | – | – |
| 2018 Silver Reverse Proof Set* | 199,116 | 199,116 | – | – |
| 2022 American Women Quarters Silver Proof Set | 57,636 | 57,640 | 4 | 0.01% |
| 2020 America the Beautiful Quarters Silver Proof Set* | 64,012 | 64,012 | – | – |
| 2019 America the Beautiful Quarters Silver Proof Set* | 78,585 | 78,585 | – | – |
| 2018 America the Beautiful Quarters Silver Proof Set* | 79,301 | 79,301 | – | – |
| 2023 Congratulations Gift Set | 26,822 | 27,417 | 595 | 2.22% |
| 2022 Congratulations Gift Set | 29,710 | 29,710 | – | – |
| 2021 Congratulations Gift Set* | 39,997 | 39,997 | – | – |
| 2020 Congratulations Gift Set* | 24,468 | 24,468 | – | – |
| 2019 Congratulations Gift Set* | 31,638 | 31,638 | – | – |
| 2022 Limited Edition Silver Proof Set | 43,588 | 43,838 | 250 | 0.57% |
| 2021 Limited Edition Silver Proof Set | 48,712 | 48,712 | – | – |
| 2020 Limited Edition Silver Proof Set* | 50,061 | 50,061 | – | – |
US Mint Uncirculated Sets | ||||
| Old Sales | Latest Sales | Gain/ Loss | % Increase | |
| 2022 Uncirculated Mint Set | 226,428 | 227,190 | 762 | 0.34% |
| 2021 Uncirculated Mint Set | 220,977 | 221,168 | 191 | 0.09% |
| 2020 Uncirculated Mint Set* | 211,787 | 211,787 | – | – |
| 2019 Uncirculated Mint Set* | 346,117 | 346,117 | – | – |
| 2018 Uncirculated Mint Set* | 257,536 | 257,536 | – | – |
| 2017 Uncirculated Mint Set* | 286,813 | 286,813 | – | – |
Kids Coin Sets | ||||
| Old Sales | Latest Sales | Gain/ Loss | % Increase | |
| 2019 Youth Coin and Currency Set | 24,061 | 24,161 | 100 | 0.42% |
| 2019 Explore and Discover Coin Set | 41,223 | 41,275 | 52 | 0.13% |
| 2019 Rocketship* | 49,921 | 49,921 | – | – |
| 2014 Coin Discovery Set* | 13,151 | 13,151 | – | – |
Ornaments | ||||
| Old Sales | Latest Sales | Gain/ Loss | % Increase | |
| 2022 U.S. Mint Ornament | 5,326 | 5,329 | 3 | 0.06% |
| 2022 Mighty Minters Ornament | 3,865 | 3,869 | 4 | 0.10% |
| 2022 Maya Angelou Ornament | 2,828 | 2,840 | 12 | 0.42% |
| 2022 Dr. Sally Ride Ornament | 2,958 | 2,967 | 9 | 0.30% |
| 2022 Wilma Mankiller Ornament | 2,062 | 2,072 | 10 | 0.48% |
| 2022 Nina Otero-Warren Ornament | 1,709 | 1,712 | 3 | 0.18% |
| 2022 Anna May Wong Ornament | 2,980 | 2,985 | 5 | 0.17% |
| 2021 Mighty Minters Ornament | 4,821 | 4,821 | – | – |
| 2021 U.S. Mint Ornament | 7,751 | 7,752 | 1 | 0.01% |
| 2020 Mighty Minters Ornament | 4,452 | 4,453 | 1 | 0.02% |
| 2020 U.S. Mint Ornament | 6,473 | 6,476 | 3 | 0.05% |
| 2019 Mighty Minters Ornament | 6,978 | 6,982 | 4 | 0.06% |
| 2019 U.S. Mint Ornament | 11,652 | 11,656 | 4 | 0.03% |
Proof & Reverse Proof Silver Eagles | ||||
| Old Sales | Latest Sales | Gain/ Loss | % Increase | |
| 2022-S Proof Silver Eagle | 199,431 | 199,528 | 97 | 0.05% |
| 2022-S Proof Silver Eagle (Bulk – 40 Coins) | 2,925 | 2,925 | – | – |
| 2023-W Proof Silver Eagle | 341,198 | 342,648 | 1,450 | 0.42% |
| 2023-W Proof Silver Eagle (Bulk – 40 Coins) | 1,777 | 1,790 | 13 | 0.73% |
| 2022-W Proof Silver Eagle | 496,990 | 496,990 | – | – |
| 2022-W Proof Silver Eagle (Bulk – 40 Coins) | 4,106 | 4,106 | – | – |
| 2021 Reverse Proof American Silver Eagle Two-Coin Set* | 124,822 | 124,822 | – | – |
| 2021-S Proof Silver Eagle, Type 2* | 199,566 | 199,566 | – | – |
| 2021-S Proof Silver Eagle, Type 2 (Bulk – 40 Coins)* | 652 | 652 | – | – |
| 2021-W Proof Silver Eagle, Type 2* | 300,091 | 300,095 | 4 | 0.00% |
| 2021-W Proof Silver Eagle, Type 2 (Bulk – 40 Coins)* | 2,142 | 2,142 | – | – |
| 2021-W Proof Silver Eagle, Type 1* | 299,830 | 299,830 | – | – |
| 2021-W Proof Silver Eagle, Type 1 (Bulk – 40 Coins)* | 686 | 686 | – | – |
Uncirculated Silver Eagles | ||||
| Old Sales | Latest Sales | Gain/ Loss | % Increase | |
| 2022 | 159,532 | 159,580 | 48 | 0.03% |
| 2022 Bulk 40 | 987 | 987 | – | – |
| 2021* | 174,467 | 174,468 | 1 | 0.00% |
| 2021 Bulk 40* | 324 | 324 | – | – |
2023 Proof American Eagle Gold Coins | ||||
| Old Sales | Latest Sales | Gain/ Loss | % Increase | |
| 1 oz | – | 4,099 | – | – |
| 1/2 oz | – | 1,380 | – | – |
| 1/4 oz | – | 4,065 | – | – |
| 1/10 oz | – | 5,642 | – | – |
| 4-Coin Set | – | 5,272 | – | – |
2022 Proof American Eagle Gold Coins | ||||
| Old Sales | Latest Sales | Gain/ Loss | % Increase | |
| 1 oz | 5,902 | 5,904 | 2 | 0.03% |
| 1/2 oz | 1,970 | 1,970 | – | – |
| 1/4 oz | 4,463 | 4,463 | – | – |
| 1/10 oz | 13,802 | 13,804 | 2 | 0.01% |
| 4-Coin Set | 9,896 | 9,901 | 5 | 0.05% |
2021 Proof American Eagle Gold Coins | ||||
| Old Sales | Latest Sales | Gain/ Loss | % Increase | |
| 1/10 oz Two-Coin Proof Set* | 4,985 | 4,985 | – | – |
| 1 oz (Type 2)* | 5,583 | 5,583 | – | – |
| 1/2 oz (Type 2)* | 1,989 | 1,989 | – | – |
| 1/4 oz (Type 2)* | 3,340 | 3,340 | – | – |
| 1/10 oz (Type 2) | 9,871 | 9,871 | – | – |
| 4-Coin Set (Type 2)* | 10,191 | 10,191 | – | – |
| 1 oz (Type 1)* | 4,448 | 4,448 | – | – |
| 1/2 oz (Type 1)* | 1,589 | 1,589 | – | – |
| 1/4 oz (Type 1)* | 2,689 | 2,689 | – | – |
| 1/10 oz (Type 1)* | 7,975 | 7,975 | – | – |
| 4-Coin Set (Type 1)* | 8,176 | 8,176 | – | – |
Uncirculated American Eagle Gold Coins | ||||
| Old Sales | Latest Sales | Gain/ Loss | % Increase | |
| 2022 | 8,797 | 8,808 | 11 | 0.13% |
| 2021* | 8,914 | 8,914 | – | – |
| 2020* | 6,284 | 6,284 | – | – |
| 2019* | 5,851 | 5,851 | – | – |
| 2018* | 8,518 | 8,518 | – | – |
| 2017* | 5,800 | 5,800 | – | – |
Proof American Buffalo Gold Coins | ||||
| Old Sales | Latest Sales | Gain/ Loss | % Increase | |
| 2022 Proof Gold Buffalo | 15,943 | 15,949 | 6 | 0.04% |
| 2021 Proof Gold Buffalo | 16,958 | 16,958 | – | – |
| 2020 Proof Gold Buffalo* | 11,887 | 11,887 | – | – |
| 2019 Proof Gold Buffalo* | 14,844 | 14,844 | – | – |
| 2018 Proof Gold Buffalo* | 15,756 | 15,756 | – | – |
| 2017 Proof Gold Buffalo* | 15,810 | 15,810 | – | – |
Proof American Platinum Eagle | ||||
| Old Sales | Latest Sales | Gain/ Loss | % Increase | |
| 2023 | 6,842 | 6,923 | 81 | 1.18% |
| 2022 | 9,817 | 9,830 | 13 | 0.13% |
| 2021 | 9,880 | 9,880 | – | – |
| 2020 | 9,771 | 9,781 | 10 | 0.10% |
| 2019 | 11,268 | 11,268 | – | – |
| 2018 | 15,885 | 15,885 | – | – |
| 2017* | 8,890 | 8,890 | – | – |
American Palladium Eagle | ||||
| Old Sales | Latest Sales | Gain/ Loss | % Increase | |
| 2022-W Reverse Proof | 7,215 | 7,263 | 48 | 0.67% |
| 2021-W Proof | 5,169 | 5,169 | – | – |
| 2020-W Uncirculated | 9,740 | 9,742 | 2 | 0.02% |
| 2019-W Reverse Proof | 18,772 | 18,772 | – | – |
| 2018-W Proof* | 14,986 | 14,986 | – | – |
Presidential Silver Medals | ||||
| Old Sales | Latest Sales | Gain/ Loss | % Increase | |
| 2023 James Buchanan Presidential Silver Medal | 11,265 | 11,304 | 39 | 0.35% |
| 2021 Franklin Pierce Presidential Silver Medal | 12,083 | 12,094 | 11 | 0.09% |
| 2022 Millard Fillmore Presidential Silver Medal | 12,300 | 12,308 | 8 | 0.07% |
| 2022 Zachary Taylor Presidential Silver Medal | 12,731 | 12,738 | 7 | 0.05% |
| 2022 James Knox Polk Presidential Silver Medal | 12,954 | 12,960 | 6 | 0.05% |
| 2021 John Tyler Presidential Silver Medal | 13,384 | 13,390 | 6 | 0.04% |
| 2021 William Henry Harrison Presidential Silver Medal | 13,317 | 13,321 | 4 | 0.03% |
| 2021 Martin Van Buren Presidential Silver Medal | 13,481 | 13,484 | 3 | 0.02% |
| 2020 Andrew Jackson Presidential Silver Medal | 16,298 | 16,313 | 15 | 0.09% |
| 2019 John Quincy Adams Presidential Silver Medal | 14,466 | 14,475 | 9 | 0.06% |
| 2019 James Monroe Presidential Silver Medal | 14,975 | 14,980 | 5 | 0.03% |
| 2019 James Madison Presidential Silver Medal | 16,433 | 16,440 | 7 | 0.04% |
| 2019 Thomas Jefferson Presidential Silver Medal | 23,378 | 23,397 | 19 | 0.08% |
| 2018 George Washington Presidential Silver Medal | 33,779 | 33,822 | 43 | 0.13% |
| 2018 John Adams Presidential Silver Medal | 23,162 | 23,168 | 6 | 0.03% |
American Innovation Reverse Proof Sets | ||||
| Old Sales | Latest Sales | Gain/ Loss | % Increase | |
| 2022 | 47,047 | 47,167 | 120 | 0.26% |
| 2021 | 49,295 | 49,296 | 1 | 0.00% |
2023 American Innovation Dollars – Ohio | ||||
| Old Sales | Latest Sales | Gain/ Loss | % Increase | |
| 25-coin roll set (P) | 7,909 | 7,912 | 3 | 0.04% |
| 25-coin roll set (D) | 6,899 | 6,907 | 8 | 0.12% |
| 100-coin bag (P) | 2,367 | 2,394 | 27 | 1.14% |
| 100-coin bag (D) | 2,187 | 2,222 | 35 | 1.60% |
2022 American Innovation Dollars – Tennessee | ||||
| Old Sales | Latest Sales | Gain/ Loss | % Increase | |
| 25-coin roll set (P) | 7,008 | 7,008 | – | – |
| 25-coin roll set (D) | 7,004 | 7,004 | – | – |
| 100-coin bag (P) | 2,770 | 2,770 | – | – |
| 100-coin bag (D) | 2,770 | 2,771 | 1 | 0.04% |
2022 American Innovation Dollars – Kentucky | ||||
| Old Sales | Latest Sales | Gain/ Loss | % Increase | |
| 25-coin roll set (P) | 6,998 | 7,004 | 6 | 0.09% |
| 25-coin roll set (D) | 6,969 | 6,971 | 2 | 0.03% |
| 100-coin bag (P) | 2,767 | 2,767 | – | – |
| 100-coin bag (D) | 2,778 | 2,778 | – | – |
2022 American Innovation Dollars – Vermont | ||||
| Old Sales | Latest Sales | Gain/ Loss | % Increase | |
| 25-coin roll set (P) | 7,023 | 7,023 | – | – |
| 25-coin roll set (D) | 6,987 | 6,999 | 12 | 0.17% |
| 100-coin bag (P) | 2,784 | 2,784 | – | – |
| 100-coin bag (D) | 2,774 | 2,775 | 1 | 0.04% |
2022 American Innovation Dollars – Rhode Island | ||||
| Old Sales | Latest Sales | Gain/ Loss | % Increase | |
| 25-coin roll set (P) | 7,010 | 7,010 | – | – |
| 25-coin roll set (D) | 7,007 | 7,007 | – | – |
| 100-coin bag (P) | 2,784 | 2,784 | – | – |
| 100-coin bag (D) | 2,776 | 2,780 | 4 | 0.14% |
2021 American Innovation Dollars – North Carolina | ||||
| Old Sales | Latest Sales | Gain/ Loss | % Increase | |
| 25-coin roll set (P) | 6,985 | 6,985 | – | – |
| 25-coin roll set (D) | 6,999 | 6,999 | – | – |
| 100-coin bag (P) | 2,785 | 2,785 | – | – |
| 100-coin bag (D) | 2,787 | 2,787 | – | – |
2021 American Innovation Dollars – New York | ||||
| Old Sales | Latest Sales | Gain/ Loss | % Increase | |
| 25-coin roll set (P) | 6,986 | 6,986 | – | – |
| 25-coin roll set (D) | 6,989 | 6,989 | – | – |
| 100-coin bag (P) | 2,766 | 2,766 | – | – |
| 100-coin bag (D) | 2,764 | 2,764 | – | – |
2021 American Innovation Dollars – Virginia | ||||
| Old Sales | Latest Sales | Gain/ Loss | % Increase | |
| 25-coin roll set (P) | 6,984 | 6,984 | – | – |
| 25-coin roll set (D) | 6,969 | 6,969 | – | – |
| 100-coin bag (P) | 2,795 | 2,795 | – | – |
| 100-coin bag (D) | 2,778 | 2,778 | – | – |
2021 American Innovation Dollars – New Hampshire | ||||
| Old Sales | Latest Sales | Gain/ Loss | % Increase | |
| 25-coin roll set (P) | 6,997 | 6,997 | – | – |
| 25-coin roll set (D) | 7,004 | 7,004 | – | – |
| 100-coin bag (P) | 2,789 | 2,789 | – | – |
| 100-coin bag (D) | 2,787 | 2,787 | – | – |
2020 American Innovation Dollars – South Carolina | ||||
| Old Sales | Latest Sales | Gain/ Loss | % Increase | |
| Reverse Proof (S) | 40,282 | 40,307 | 25 | 0.06% |
| 25-coin roll set (P) | 6,378 | 6,378 | – | – |
| 25-coin roll set (D) | 6,399 | 6,399 | – | – |
| 100-coin bag (P) | 2,734 | 2,734 | – | – |
| 100-coin bag (D) | 2,378 | 2,378 | – | – |
2020 American Innovation Dollars – Maryland | ||||
| Old Sales | Latest Sales | Gain/ Loss | % Increase | |
| Reverse Proof (S) | 49,654 | 49,661 | 7 | 0.01% |
| 25-coin roll set (P) | 6,493 | 6,493 | – | – |
| 25-coin roll set (D) | 6,471 | 6,471 | – | – |
| 100-coin bag (P) | 2,725 | 2,725 | – | – |
| 100-coin bag (D) | 2,737 | 2,737 | – | – |
2020 American Innovation Dollars – Massachusetts | ||||
| Old Sales | Latest Sales | Gain/ Loss | % Increase | |
| Reverse Proof (S) | 47,146 | 47,179 | 33 | 0.07% |
| 25-coin roll set (P) | 6,486 | 6,486 | – | – |
| 25-coin roll set (D) | 6,481 | 6,481 | – | – |
| 100-coin bag (P) | 2,746 | 2,746 | – | – |
| 100-coin bag (D) | 2,744 | 2,744 | – | – |
2020 American Innovation Dollars – Connecticut | ||||
| Old Sales | Latest Sales | Gain/ Loss | % Increase | |
| Reverse Proof (S) | 46,049 | 46,062 | 13 | 0.03% |
| 25-coin roll set (P) | 6,496 | 6,496 | – | – |
| 25-coin roll set (D) | 6,425 | 6,425 | – | – |
| 100-coin bag (P) | 2,736 | 2,736 | – | – |
| 100-coin bag (D) | 2,747 | 2,747 | – | – |
2019 American Innovation Dollars – Georgia | ||||
| Old Sales | Latest Sales | Gain/ Loss | % Increase | |
| Reverse Proof (S) | 46,208 | 46,233 | 25 | 0.05% |
| 25-coin roll set (P) | 7,691 | 7,698 | 7 | 0.09% |
| 25-coin roll set (D) | 7,191 | 7,196 | 5 | 0.07% |
| 100-coin bag (P) | 3,257 | 3,259 | 2 | 0.06% |
| 100-coin bag (D) | 3,148 | 3,153 | 5 | 0.16% |
2019 American Innovation Dollars – New Jersey | ||||
| Old Sales | Latest Sales | Gain/ Loss | % Increase | |
| Reverse Proof (S) | 49,566 | 49,617 | 51 | 0.10% |
| 25-coin roll set (P) | 8,550 | 8,561 | 11 | 0.13% |
| 25-coin roll set (D) | 7,664 | 7,672 | 8 | 0.10% |
| 100-coin bag (P) | 3,700 | 3,705 | 5 | 0.14% |
| 100-coin bag (D) | 3,341 | 3,348 | 7 | 0.21% |
2019 American Innovation Dollars – Pennsylvania | ||||
| Old Sales | Latest Sales | Gain/ Loss | % Increase | |
| Reverse Proof (S) | 54,039 | 54,064 | 25 | 0.05% |
| 25-coin roll set (P) | 9,742 | 9,755 | 13 | 0.13% |
| 25-coin roll set (D) | 8,117 | 8,126 | 9 | 0.11% |
| 100-coin bag (P) | 3,300 | 3,313 | 13 | 0.39% |
| 100-coin bag (D) | 2,871 | 2,874 | 3 | 0.10% |
2019 American Innovation Dollars – Delaware | ||||
| Old Sales | Latest Sales | Gain/ Loss | % Increase | |
| Reverse Proof (S) | 69,330 | 69,363 | 33 | 0.05% |
| 25-coin roll set (P) | 8,709 | 8,716 | 7 | 0.08% |
| 25-coin roll set (D) | 8,070 | 8,078 | 8 | 0.10% |
| 100-coin bag (P) | 3,044 | 3,050 | 6 | 0.20% |
| 100-coin bag (D) | 3,238 | 3,242 | 4 | 0.12% |
2018 American Innovation Dollars | ||||
| Old Sales | Latest Sales | Gain/ Loss | % Increase | |
| Reverse Proof (S)* | 74,720 | 74,720 | – | – |
| Proof Coin (S) | 250,591 | 250,648 | 57 | 0.02% |
| 25-coin roll set (P) | 21,682 | 21,732 | 50 | 0.23% |
| 25-coin roll set (D) | 24,656 | 24,684 | 28 | 0.11% |
| 100-coin bag (P)* | 2,935 | 2,935 | – | – |
| 100-coin bag (D)* | 2,954 | 2,954 | – | – |
George H.W. Bush Coin & Chronicles Set | ||||
| Old Sales | Latest Sales | Gain/ Loss | % Increase | |
| $1 Coin & Set | 10,947 | 10,961 | 14 | 0.13% |
2020 Bush Presidential $1 Coin & First Spouse Medal Set | ||||
| Old Sales | Latest Sales | Gain/ Loss | % Increase | |
| $1 Coin & Set | 9,876 | 9,876 | – | – |
2020 George H.W. Bush Presidential $1 Coins | ||||
| Old Sales | Latest Sales | Gain/ Loss | % Increase | |
| 25-coin roll (P) | 24,186 | 24,226 | 40 | 0.17% |
| 25-coin roll (D) | 21,012 | 21,039 | 27 | 0.13% |
| 100-coin bag (P) | 2,695 | 2,695 | – | – |
| 100-coin bag (D) | 2,098 | 2,098 | – | – |
| 250-coin bag (P) | 2,509 | 2,517 | 8 | 0.32% |
| 250-coin bag (D) | 4,044 | 4,056 | 12 | 0.30% |
Native American Dollar Rolls | ||||
| Old Sales | Latest Sales | Gain/ Loss | % Increase | |
| 2023-P Native American $1 25 Coin Roll | 11,318 | 11,477 | 159 | 1.40% |
| 2023-D Native American $1 25 Coin Roll | 10,939 | 11,075 | 136 | 1.24% |
| 2023-P Native American $1 100-Coin Bag | 1,433 | 1,469 | 36 | 2.51% |
| 2023-D Native American $1 100-Coin Bag | 1,420 | 1,438 | 18 | 1.27% |
| 2023-P Native American $1 250-Coin Box | 817 | 878 | 61 | 7.47% |
| 2023-D Native American $1 250-Coin Box | 956 | 1,016 | 60 | 6.28% |
| 2022-P Native American $1 25 Coin Roll | 13,929 | 13,939 | 10 | 0.07% |
| 2022-D Native American $1 25 Coin Roll | 13,903 | 13,908 | 5 | 0.04% |
| 2022-P Native American $1 100-Coin Bag | 1,695 | 1,696 | 1 | 0.06% |
| 2022-D Native American $1 100-Coin Bag | 1,610 | 1,610 | – | – |
| 2022-P Native American $1 250-Coin Box | 1,698 | 1,698 | – | – |
| 2022-D Native American $1 250-Coin Box | 1,699 | 1,699 | – | – |
| 2021-P Native American $1 25 Coin Roll | 15,975 | 15,975 | – | – |
| 2021-D Native American $1 25 Coin Roll | 14,967 | 14,967 | – | – |
| 2021-P Native American $1 100-Coin Bag | 1,704 | 1,704 | – | – |
| 2021-D Native American $1 100-Coin Bag | 1,618 | 1,618 | – | – |
| 2021-P Native American $1 250-Coin Box | 1,789 | 1,789 | – | – |
| 2021-D Native American $1 250-Coin Box | 1,795 | 1,795 | – | – |
Kennedy Half Dollar Rolls | ||||
| Old Sales | Latest Sales | Gain/ Loss | % Increase | |
| 2022-dated 200-coin bag (P&D) | 10,997 | 10,997 | – | – |
| 2022-dated 2-roll set (P&D) | 21,882 | 21,882 | – | – |
| 2021-dated 200-coin bag (P&D) | 9,968 | 9,968 | – | – |
| 2021-dated 2-roll set (P&D) | 21,953 | 21,953 | – | – |
| 2020-dated 200-coin bag (P&D) | 11,776 | 11,776 | – | – |
| 2020-dated 2-roll set (P&D) | 24,312 | 24,312 | – | – |
| 2019-dated 200-coin bag (P&D)* | 11,534 | 11,534 | – | – |
| 2019-dated 2-roll set (P&D)* | 24,132 | 24,132 | – | – |
2023 Edith Kanakaʻole Quarters | ||||
| Old Sales | Latest Sales | Gain/ Loss | % Increase | |
| Three-Roll Set | – | 12,566 | – | – |
| 100-Coin Bag (P) | – | 2,445 | – | – |
| 100-Coin Bag (D) | – | 2,247 | – | – |
| Two-Roll Set | – | 4,391 | – | – |
2023 Bessie Coleman Quarters | ||||
| Old Sales | Latest Sales | Gain/ Loss | % Increase | |
| Three-Roll Set | 12,438 | 12,496 | 58 | 0.47% |
| 100-Coin Bag (P) | 4,851 | 4,899 | 48 | 0.99% |
| 100-Coin Bag (D) | 4,459 | 4,499 | 40 | 0.90% |
| Two-Roll Set | 4,836 | 4,943 | 107 | 2.21% |
2022 Anna May Wong Quarters | ||||
| Old Sales | Latest Sales | Gain/ Loss | % Increase | |
| Three-Roll Set | 7,617 | 7,617 | – | – |
| 100-Coin Bag (P) | 1,860 | 1,860 | – | – |
| 100-Coin Bag (D) | 1,855 | 1,858 | 3 | 0.16% |
| Two-Roll Set | 5,936 | 5,936 | – | – |
2022 Nina Otero-Warren Quarters | ||||
| Old Sales | Latest Sales | Gain/ Loss | % Increase | |
| Three-Roll Set | 7,639 | 7,639 | – | – |
| 100-Coin Bag (P) | 1,852 | 1,852 | – | – |
| 100-Coin Bag (D) | 1,853 | 1,853 | – | – |
| Two-Roll Set | 5,878 | 5,878 | – | – |
2022 Wilma Mankiller Quarters | ||||
| Old Sales | Latest Sales | Gain/ Loss | % Increase | |
| Three-Roll Set | 7,616 | 7,616 | – | – |
| 100-Coin Bag (P) | 1,848 | 1,848 | – | – |
| 100-Coin Bag (D) | 1,822 | 1,822 | – | – |
| Two-Roll Set | 5,909 | 5,909 | – | – |
2022 Dr. Sally Ride Quarters | ||||
| Old Sales | Latest Sales | Gain/ Loss | % Increase | |
| Three-Roll Set | 7,603 | 7,603 | – | – |
| 100-Coin Bag (P) | 1,853 | 1,853 | – | – |
| 100-Coin Bag (D) | 1,854 | 1,852 | -2 | -0.11% |
| Two-Roll Set | 5,924 | 5,924 | – | – |
2022 Maya Angelou Quarters | ||||
| Old Sales | Latest Sales | Gain/ Loss | % Increase | |
| Three-Roll Set | 7,588 | 7,588 | – | – |
| 100-Coin Bag (P) | 1,858 | 1,858 | – | – |
| 100-Coin Bag (D) | 1,861 | 1,861 | – | – |
| Two-Roll Set | 5,937 | 5,937 | – | – |