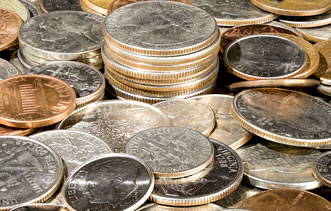
U.S. coin production soared in June, registering the biggest output since January 2018, after three rather lackluster months.
Across a longer stretch of time, the United States Mint pressed just over 6.5 billion coins for circulation in the first half of 2020. That’s seemingly an enormous amount but it’s tracking toward a fifth straight annual decline.
In the headline figure for June, U.S. Mint presses struck nearly 1.6 billion coins, logging increases of 76.6% from May and 56.3% from June 2019.
Here’s how the month compares against others in the past year:
June 2019 to June 2020 Circulating Coin Production
| Month | Mintages | Rank |
| June 2020 | 1,596.48 M | 1 |
| May 2020 | 904.12 M | 8 |
| April 2020 | 801.84 M | 11 |
| March 2020 | 898.86 M | 9 |
| February 2020 | 1,094.30 M | 5 |
| January 2020 | 1,228.08 M | 2 |
| December 2019 | 400.88 M | 13 |
| November 2019 | 898.38 M | 10 |
| October 2019 | 1,154.94 M | 4 |
| September 2019 | 939.66 M | 7 |
| August 2019 | 767.32 M | 12 |
| July 2019 | 1,202.10 M | 3 |
| June 2019 | 1,021.654 M | 6 |
The Federal Reserve orders more 1-cent coins than any other denomination despite data that shows it costs the U.S. Mint 1.99 cents to make and distribute each one. The Mint produced 889.6 million Lincoln cents last month, representing 55.7% of the circulating-quality coins produced in June.
Month-Over-Month
In month-over month comparisons for coins used daily by Americans, production totals in June increased by:
- 83.8% Lincoln cents,
- 72.3% Jefferson nickels,
- 48.8% Roosevelt dimes, and
- 103.5% America the Beautiful quarter dollars.
Native American $1 Coins and Kennedy half-dollars are no longer ordered by Federal Reserve Banks but they are still made in circulating quality for coin collectors. Usually in January, the U.S. Mint tends to strike both coins to the expected amounts needed for the entire year. That wasn’t the case for halves at least until the second month of this year.
In February, mintages of Philadelphia Mint-struck Kennedy half-dollars rose by 1.8 million after none were reported out of the plant in January. That added to the earlier 1.8 million produced Denver halves for a combined 3.6 million. For reference, last year’s half-dollar ended with equal splits of 1.7 million for Denver and Philadelphia for a combined 3.4 million.
Published mintages of the Native American dollar remained unchanged — 1.26 million from Denver and 1.4 million from Philadelphia for a combined 2.66 million coins. Last year’s issue had splits of 1.54 million for Denver and 1.4 million for Philadelphia for a combined 2.94 million coins.
Here’s a summary of all circulating-quality coins produced last month:
US Mint Circulating Coin Production in June 2020
| Denomination | Denver | Philadelphia | Total |
| Lincoln Cents | 471,600,000 | 418,000,000 | 889,600,000 |
| Jefferson Nickels | 79,680,000 | 82,800,000 | 162,480,000 |
| Roosevelt Dimes | 155,000,000 | 168,000,000 | 323,000,000 |
| ATB Quarters | 114,800,000 | 106,600,000 | 221,400,000 |
| Kennedy Half Dollars | 0 | 0 | 0 |
| Native American $1s | 0 | 0 | 0 |
| Total | 821,080,000 | 775,400,000 | 1,596,480,000 |
U.S. Mint plants in Denver and Philadelphia manufacture all of America’s coins for commerce. Last month, the Denver Mint made 821.08 million coins and the Philadelphia Mint made 775.4 million coins for the combined 1,596,480,000 coins.
Coin Production in First Half of 2020
Through the first half of this year, the Denver Mint struck 3,398,000,000 coins and the Philadelphia Mint struck 3,125,680,000 coins for a combined 6,523,680,000 coins — 0.8% fewer than the 6,578,954,400 coins minted through the first half of 2019.
This next table lists 2020 coin production totals by denomination and by U.S. Mint facility:
YTD 2020 Circulating Coin Production by Denomination
| 1 ¢ | 5 ¢ | 10 ¢ | 25 ¢ | 50 ¢ | N.A. $1 | Total: | |
|---|---|---|---|---|---|---|---|
| Denver | 1879.6M | 331.44M | 612.5M | 571.4M | 1.8M | 1.26M | 3398M |
| Philadelphia | 1682.4M | 288.48M | 577M | 574.6M | 1.8M | 1.4M | 3125.68M |
| Total | 3562M | 619.92M | 1189.5M | 1146M | 3.6M | 2.66M | 6523.68M |
If the average monthly production pace was maintained through to the end of this year, the annual mintage for 2020 would top 13 billion coins. Usually, however, coin production slows significantly in December as the U.S. Mint prepares for newly dated coinage for the upcoming year. The Mint made over 11.9 billion coins for circulation in 2019.
Mintages by Unique Design
The Mint through the first half of 2020 released four standard coins with one-year-only designs. They include:
- the 2020 National Park of American Samoa quarter, which launched on Feb. 3,
- the 2020 Native American dollars, released on Feb. 12,
- the 2020 Weir Farm National Historic Site quarter for Connecticut, which went into circulation on April 6, and,
- the 2020 Salt River Bay National Historical Park and Ecological Preserve quarter, which launched into circulation on June 1.
The following table offers a mintage breakdown for it and other denominations:
2020 Circulating Coin Production by Design
| Denver | Philadelphia | Total | |
| Lincoln Cents | 1,879,600,000 | 1,682,400,000 | 3,562,000,000 |
| Jefferson Nickels | 331,440,000 | 288,480,000 | 619,920,000 |
| Roosevelt Dimes | 612,500,000 | 577,000,000 | 1,189,500,000 |
| National Park of American Samoa Quarter | 212,200,000 | 286,000,000 | 498,200,000 |
| Weir Farm National Historic Site Quarter (Connecticut) | 155,000,000 | 125,600,000 | 280,600,000 |
| Salt River Bay National Historical Park and Ecological Preserve Quarter (U.S. Virgin Islands) | 0 | 0 | 0 |
| Marsh-Billings-Rockefeller National Historical Park Quarter (Vermont) | 0 | 0 | 0 |
| Tallgrass Prairie National Preserve Quarter (Kansas) | 0 | 0 | 0 |
| Kennedy Half-Dollars | 1,800,000 | 1,800,000 | 3,600,000 |
| Native American $1 Coins | 1,260,000 | 1,400,000 | 2,660,000 |
| Total | 3,193,800,000 | 2,962,680,000 | 6,156,480,000 |
There are 367.2 million in quarters that the U.S. Mint has yet to officially assign to a design. These are likely a portion of U.S. Virgin Islands’ Salt River Bay quarters.


