Last week, the United States Mint did not release any new products, resulting in a lack of items with truly explosive sales. However, the U.S. Mint did conclude ordering for the 2024 Liberty & Britannia Gold Coin and Silver Medal, and its latest sales figures reveal that one of them experienced a decent weekly gain. Additionally, the figures show the performance of the Greatest Generation Commemorative Coins during their first full week of sales.
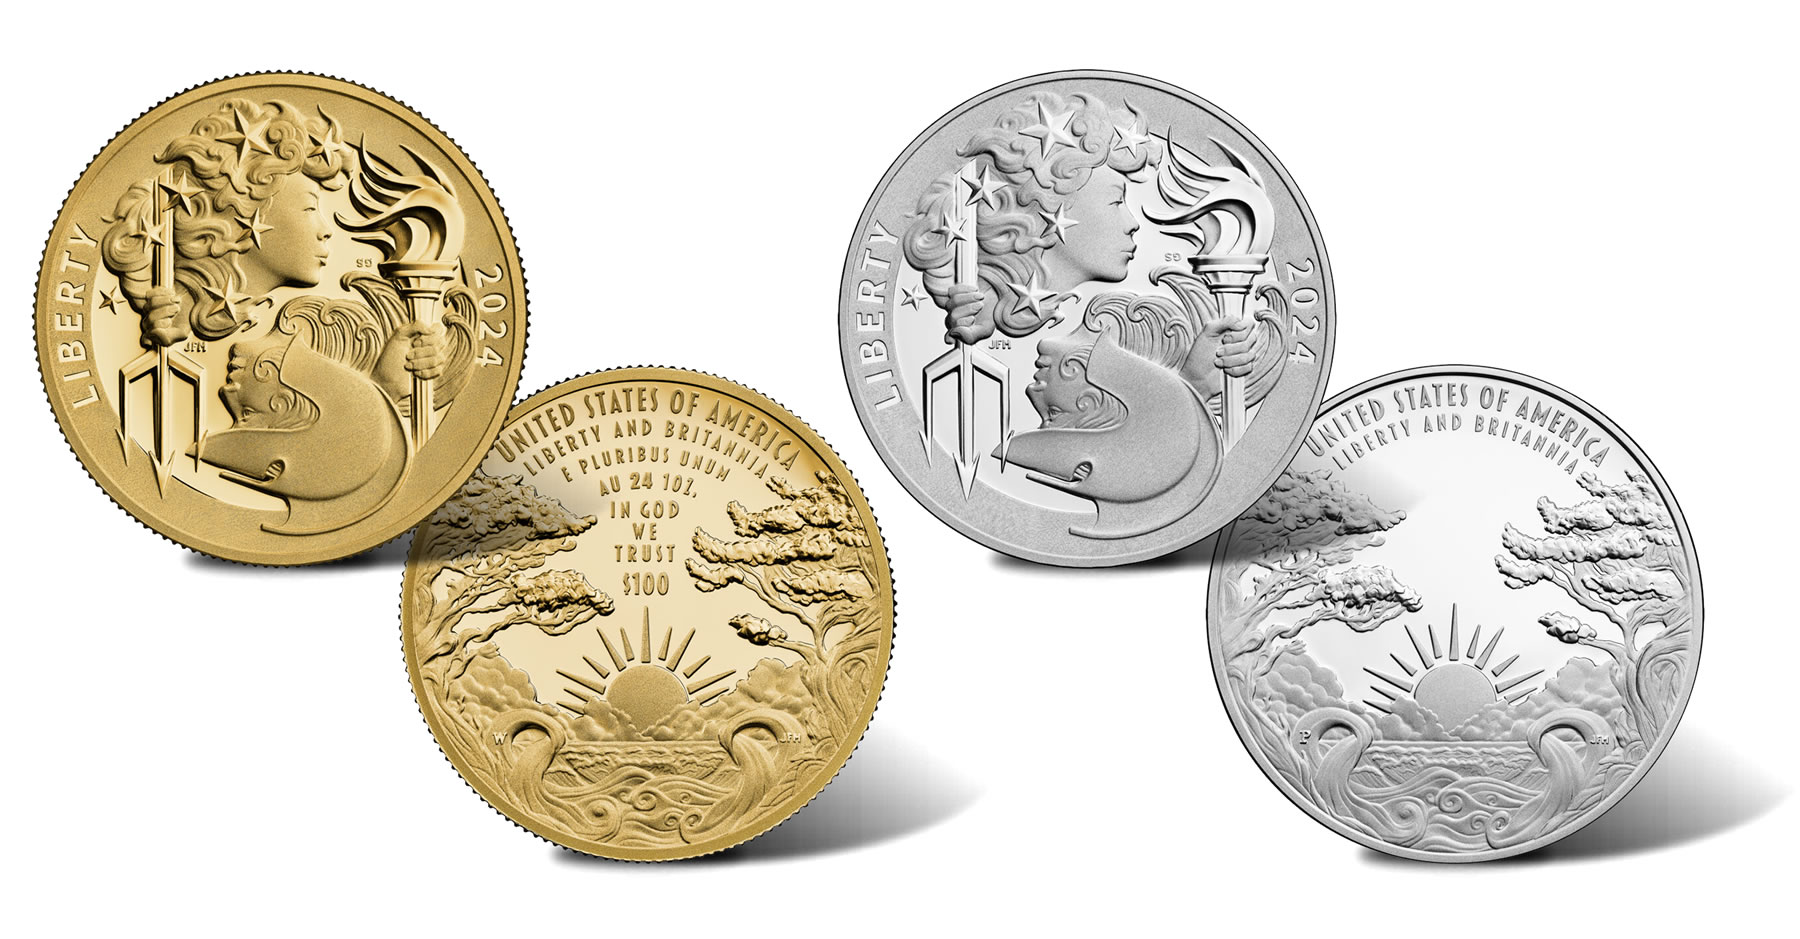
On Feb. 8, sales of the Liberty & Britannia products began with a 30-day ordering window ending this past Friday, March 8. Mintages were limited to 10,000 for the 2024-W Liberty & Britannia Gold Coin and 75,000 for the 2024-P Liberty & Britannia Silver Medal. The following table displays the weekly performance of the pair from start to finish.
Sales of Liberty & Britannia Products
| Week Ending Feb. 11 | Week Ending Feb. 18 | Week Ending Feb. 25 | Week Ending March 3 | Week Ending March 10 | |
| Gold Coin | 4,013 | +791 to 4,804 | +130 to 4,934 | +130 to 5,064 | +461 to 5,525 |
| Silver Medal | 16,218 | +9,705 to 25,923 | +260 to 26,183 | +1,872 to 28,055 | +4,849 to 32,904 |
Per the latest weekly sales data, the silver medal was the Mint’s top-selling numismatic product for the week ending March 10.
Sales Update for Greatest Generation Commemorative Coins
Elsewhere, most of the Greatest Generation Commemorative Coins held some top sales positions. These coins completed their first full week of sales after their Feb. 29 pre-sale release. Orders for the coins are not scheduled to start shipping until April 5, and a $5 discount is available for each coin through March 29.
Four of the six Greatest Generation products made it to the U.S. Mint’s top-ten sales list. The more expensive three-coin set and the uncirculated gold coin missed the top ten, ranking 12th and 19th, respectively
Among them, the 2024-P Proof Greatest Generation Silver Dollar emerged as the most popular this time around. Last week, it was the Mint’s second-best seller, as it followed the debuting 2024 American Women Quarters Proof Set, which launched on Feb. 27. The proof silver dollar maintained its position as the second-best weekly seller, with sales increasing by 1,773 to reach 17,181. Meanwhile, the quarters proof set ranked sixth overall, with sales climbing by 629 to reach 36,737.
U.S. Mint Top Seller’s
Here is the roster of the U.S. Mint’s most sought-after numismatic products for the week ending on March 10:
- 2024-P Liberty & Britannia Silver Medal (+4,849 to 32,904)
- 2024-P Proof Greatest Generation Silver Dollar (+1,773 to 17,181)
- 2024-W Proof Silver Eagle (+1,087 to 231,817)
- 2024-S Proof Greatest Generation Half Dollar (+1,025 to 11,448)
- 2024-P Uncirculated Greatest Generation Silver Dollar (+708 to 6,522)
- 2024 American Women Quarters Proof Set (+629 to 36,737)
- 2023 Mint Set (+496 to 174,578)
- 2024-W Liberty & Britannia Gold Coin (+461 to 5,525)
- 2024-D Uncirculated Greatest Generation Half Dollar (+433 to 5,390)
- 2023-S Proof Peace Silver Dollar (+353 to 312,801)
In its latest report, the U.S. Mint published sales data for 432 numismatic products. The data revealed that 119 products outperformed their sales from the previous week, compared to 39 in the prior report. Two products experienced an increase of more than 1,000 units, the same as in the previous report.
In addition, 3 products recorded negative weekly sales, while there were 17 in the previous report. One of them was high, with the 2024 Rutherford B. Hayes Presidential Silver Medal falling by 687.
US Mint Sales: Numismatic Products
Below are tables showing the latest available sales for U.S. Mint numismatic products. The sales period covers from March 4 to March 10. Products with an asterisk (*) are no longer available or had no reported sales.
2024 Commemorative Coins |
||||
| Old Sales |
Latest Sales |
Gain/ Loss |
% Increase |
|
| 2024-S Proof Greatest Generation Half Dollar | 10,423 | 11,448 | 1,025 | 9.83% |
| 2024-D Uncirculated Greatest Generation Half Dollar | 4,957 | 5,390 | 433 | 8.74% |
| 2024-P Proof Greatest Generation Silver Dollar | 15,408 | 17,181 | 1,773 | 11.51% |
| 2024-P Uncirculated Greatest Generation Silver Dollar | 5,814 | 6,522 | 708 | 12.18% |
| 2024-W Proof Greatest Generation $5 Gold Coin | 826 | 961 | 135 | 16.34% |
| 2024-W Uncirculated Greatest Generation $5 Gold Coin | 669 | 814 | 145 | 21.67% |
| 2024 Greatest Generation Three-Coin Proof Set | 2,502 | 2,837 | 335 | 13.39% |
| 2024-S Proof Harriet Tubman Half Dollar | 9,555 | 9,632 | 77 | 0.81% |
| 2024-D Uncirculated Harriet Tubman Half Dollar | 5,221 | 5,256 | 35 | 0.67% |
| 2024-P Proof Harriet Tubman Silver Dollar | 15,270 | 15,479 | 209 | 1.37% |
| 2024-P Uncirculated Harriet Tubman Silver Dollar | 5,800 | 5,866 | 66 | 1.14% |
| 2024-W Proof Harriet Tubman $5 Gold Coin | 1,304 | 1,300 | -4 | -0.31% |
| 2024-W Uncirculated Harriet Tubman $5 Gold Coin | 981 | 996 | 15 | 1.53% |
| 2024 Harriet Tubman Three-Coin Proof Set | 3,655 | 3,686 | 31 | 0.85% |
Morgan & Peace Silver Dollars |
||||
| Old Sales |
Latest Sales |
Gain/ Loss |
% Increase |
|
| 2023-S Morgan & Peace Silver Dollar Reverse Proof Set | 247,826 | 247,035 | -791 | -0.32% |
| 2023-S Proof Morgan Silver Dollar | 345,604 | 345,574 | -30 | -0.01% |
| 2023-S Proof Morgan Silver Dollar (Bulk – 40 Coins) | 443 | 443 | – | – |
| 2023-S Proof Peace Silver Dollar | 312,448 | 312,801 | 353 | 0.11% |
| 2023-S Proof Peace Silver Dollar (Bulk – 40 Coins) | 438 | 438 | – | – |
| 2023-P Uncirculated Morgan Silver Dollar | 260,475 | 260,476 | 1 | 0.00% |
| 2023-P Uncirculated Morgan Silver Dollar (40 – Bulk) | 330 | 330 | – | – |
| 2023-P Uncirculated Peace Silver Dollar | 258,898 | 258,898 | – | – |
| 2023-P Uncirculated Peace Silver Dollar (40 – Bulk) | 338 | 338 | – | – |
2024 Liberty & Britannia |
||||
| Old Sales |
Latest Sales |
Gain/ Loss |
% Increase |
|
| 2024-W Liberty & Britannia Gold Coin | 5,064 | 5,525 | 461 | 9.10% |
| 2024-P Liberty & Britannia Silver Medal | 28,055 | 32,904 | 4,849 | 17.28% |
Armed Forces Silver Medals |
||||
| Old Sales |
Latest Sales |
Gain/ Loss |
% Increase |
|
| U.S. Army 2.5 Ounce Silver Medal | 9,988 | 9,988 | – | – |
| U.S. Marine Corps 2.5 Ounce Silver Medal | 9,575 | 9,575 | – | – |
| U.S. Navy 2.5 Ounce Silver Medal | 9,987 | 9,987 | – | – |
| U.S. Coast Guard 2.5 Ounce Silver Medal | 9,955 | 9,955 | – | – |
| U.S. Air Force 2.5 Ounce Silver Medal | 9,953 | 9,953 | – | – |
| U.S. Marine Corps 1 Ounce Silver Medal | 18,566 | 18,601 | 35 | 0.19% |
| U.S. Navy 1 Ounce Silver Medal | 19,888 | 19,923 | 35 | 0.18% |
| U.S. Coast Guard 1 Ounce Silver Medal | 17,596 | 17,608 | 12 | 0.07% |
| U.S. Air Force 1 Ounce Silver Medal | 20,019 | 20,037 | 18 | 0.09% |
American Liberty Products |
||||
| Old Sales |
Latest Sales |
Gain/ Loss |
% Increase |
|
| 2023-W $100 American Liberty Gold Coin | 12,171 | 12,172 | 1 | 0.01% |
| 2023-P American Liberty Silver Medal | 30,947 | 31,090 | 143 | 0.46% |
| 2022-P American Liberty Silver Medal | 74,340 | 74,341 | 1 | 0.00% |
| 2021-W $100 American Liberty Gold Coin | 12,471 | 12,471 | – | – |
| 2019-W $100 American Liberty Gold Coin | 24,609 | 24,609 | – | – |
| 2019-P American Liberty Silver Medal | 44,928 | 44,928 | – | – |
| 2018-W $10 American Liberty Gold Coin | 59,231 | 59,293 | 62 | 0.10% |
| 2017 American Liberty Silver Four-Medal Set* | 32,647 | 32,647 | – | – |
| 2017-S Enhanced Uncirculated Coin Set* | 210,419 | 210,419 | – | – |
| 2017-W $100 American Liberty Gold Coin | 39,174 | 39,189 | 15 | 0.04% |
| 2017-P Proof American Liberty Silver Medal* | 55,187 | 55,187 | – | – |
Clad Proof Sets |
||||
| Old Sales |
Latest Sales |
Gain/ Loss |
% Increase |
|
| 2023 Proof Set | 368,534 | 368,593 | 59 | 0.02% |
| 2022 Proof Set | 400,014 | 400,014 | – | – |
| 2021 Proof Set | 512,807 | 512,807 | – | – |
| 2020 Proof Set* | 464,658 | 464,658 | – | – |
| 2019 Proof Set* | 601,364 | 601,364 | – | – |
| 2018 Proof Set* | 517,081 | 517,081 | – | – |
| 2017 Proof Set* | 568,678 | 568,678 | – | – |
| 2023 American Innovation Dollars Proof Set | 53,118 | 53,299 | 181 | 0.34% |
| 2022 American Innovation Dollars Proof Set | 79,032 | 79,096 | 64 | 0.08% |
| 2021 American Innovation Dollars Proof Set | 85,330 | 85,374 | 44 | 0.05% |
| 2020 American Innovation Dollars Proof Set | 107,067 | 107,067 | – | – |
| 2019 American Innovation Dollars Proof Set | 148,380 | 148,436 | 56 | 0.04% |
| 2024 American Women Quarters Proof Set | 36,108 | 36,737 | 629 | 1.74% |
| 2023 American Women Quarters Proof Set | 55,604 | 55,699 | 95 | 0.17% |
| 2022 American Women Quarters Proof Set* | 42,821 | 42,821 | – | – |
| 2020 America the Beautiful Quarters Proof Set* | 64,242 | 64,242 | – | – |
| 2019 America the Beautiful Quarters Proof Set | 84,679 | 84,692 | 13 | 0.02% |
| 2018 America the Beautiful Quarters Proof Set* | 86,697 | 86,697 | – | – |
Silver Proof Sets |
||||
| Old Sales |
Latest Sales |
Gain/ Loss |
% Increase |
|
| 2023 Silver Proof Set | 189,521 | 189,848 | 327 | 0.17% |
| 2022 Silver Proof Set | 247,746 | 247,821 | 75 | 0.03% |
| 2021 Silver Proof Set | 302,353 | 302,394 | 41 | 0.01% |
| 2020 Silver Proof Set* | 313,183 | 313,183 | – | – |
| 2019 Silver Proof Set* | 412,708 | 412,708 | – | – |
| 2018 Silver Proof Set* | 332,273 | 332,273 | – | – |
| 2018 Silver Reverse Proof Set* | 199,116 | 199,116 | – | – |
| 2023 American Women Quarters Silver Proof Set | 44,663 | 44,710 | 47 | 0.11% |
| 2022 American Women Quarters Silver Proof Set | 57,689 | 57,691 | 2 | 0.00% |
| 2020 America the Beautiful Quarters Silver Proof Set* | 64,012 | 64,012 | – | – |
| 2019 America the Beautiful Quarters Silver Proof Set* | 78,588 | 78,588 | – | – |
| 2018 America the Beautiful Quarters Silver Proof Set* | 79,301 | 79,301 | – | – |
| 2024 Congratulations Gift Set | 16,936 | 17,179 | 243 | 1.43% |
| 2023 Congratulations Gift Set | 39,268 | 39,268 | – | – |
| 2022 Congratulations Gift Set | 29,710 | 29,710 | – | – |
| 2021 Congratulations Gift Set* | 39,997 | 39,997 | – | – |
| 2020 Congratulations Gift Set* | 24,468 | 24,468 | – | – |
| 2019 Congratulations Gift Set* | 31,638 | 31,638 | – | – |
| 2023 Limited Edition Silver Proof Set | 24,363 | 24,479 | 116 | 0.48% |
| 2022 Limited Edition Silver Proof Set | 49,711 | 49,711 | – | – |
| 2021 Limited Edition Silver Proof Set | 48,712 | 48,712 | – | – |
| 2020 Limited Edition Silver Proof Set* | 50,061 | 50,061 | – | – |
US Mint Uncirculated Sets |
||||
| Old Sales |
Latest Sales |
Gain/ Loss |
% Increase |
|
| 2023 Uncirculated Mint Set | 174,082 | 174,578 | 496 | 0.28% |
| 2022 Uncirculated Mint Set | 249,975 | 249,973 | -2 | 0.00% |
| 2021 Uncirculated Mint Set | 228,851 | 228,954 | 103 | 0.05% |
| 2020 Uncirculated Mint Set* | 211,787 | 211,787 | – | – |
| 2019 Uncirculated Mint Set* | 346,117 | 346,117 | – | – |
| 2018 Uncirculated Mint Set* | 257,536 | 257,536 | – | – |
| 2017 Uncirculated Mint Set* | 286,813 | 286,813 | – | – |
Kids Coin Sets |
||||
| Old Sales |
Latest Sales |
Gain/ Loss |
% Increase |
|
| 2019 Youth Coin and Currency Set | 24,888 | 24,888 | – | – |
| 2019 Explore and Discover Coin Set | 43,911 | 43,910 | -1 | 0.00% |
| 2019 Rocketship* | 49,921 | 49,921 | – | – |
| 2014 Coin Discovery Set* | 13,151 | 13,151 | – | – |
Ornaments |
||||
| Old Sales |
Latest Sales |
Gain/ Loss |
% Increase |
|
| 2023 U.S. Mint Ornament | 4,970 | 4,973 | 3 | 0.06% |
| 2023 Mighty Minters Ornament | 3,045 | 3,045 | – | – |
| 2022 U.S. Mint Ornament | 5,724 | 5,727 | 3 | 0.05% |
| 2022 Mighty Minters Ornament | 4,094 | 4,096 | 2 | 0.05% |
| 2023 Bessie Coleman Ornament | 1,211 | 1,213 | 2 | 0.17% |
| 2023 Edith Kanakaʻole Ornament; | 1,381 | 1,386 | 5 | 0.36% |
| 2023 Eleanor Roosevelt Ornament | 1,649 | 1,653 | 4 | 0.24% |
| 2023 Jovita Idar Ornament | 1,218 | 1,220 | 2 | 0.16% |
| 2023 Maria Tallchief Ornament | 1,454 | 1,456 | 2 | 0.14% |
| 2022 Maya Angelou Ornament | 3,223 | 3,235 | 12 | 0.37% |
| 2022 Dr. Sally Ride Ornament | 3,320 | 3,327 | 7 | 0.21% |
| 2022 Wilma Mankiller Ornament | 2,309 | 2,313 | 4 | 0.17% |
| 2022 Nina Otero-Warren Ornament | 1,817 | 1,819 | 2 | 0.11% |
| 2022 Anna May Wong Ornament | 3,222 | 3,224 | 2 | 0.06% |
| 2021 Mighty Minters Ornament | 4,821 | 4,821 | – | – |
| 2021 U.S. Mint Ornament | 7,967 | 7,967 | – | – |
| 2020 Mighty Minters Ornament | 4,567 | 4,569 | 2 | 0.04% |
| 2020 U.S. Mint Ornament | 6,691 | 6,693 | 2 | 0.03% |
| 2019 Mighty Minters Ornament | 7,101 | 7,101 | – | – |
| 2019 U.S. Mint Ornament | 11,945 | 11,946 | 1 | 0.01% |
Proof & Reverse Proof Silver Eagles |
||||
| Old Sales |
Latest Sales |
Gain/ Loss |
% Increase |
|
| 2024-W Proof Silver Eagle | 230,730 | 231,817 | 1,087 | 0.47% |
| 2024-W Proof Silver Eagle (Bulk – 40 Coins) | 1,392 | 1,392 | – | – |
| 2023-S Proof Silver Eagle | 178,079 | 178,229 | 150 | 0.08% |
| 2023-S Proof Silver Eagle (Bulk – 40 Coins) | 743 | 743 | – | – |
| 2022-S Proof Silver Eagle | 199,698 | 199,698 | – | – |
| 2022-S Proof Silver Eagle (Bulk – 40 Coins) | 2,925 | 2,925 | – | – |
| 2023-W Proof Silver Eagle | 436,375 | 436,375 | – | – |
| 2023-W Proof Silver Eagle (Bulk – 40 Coins) | 2,119 | 2,119 | – | – |
| 2022-W Proof Silver Eagle | 496,993 | 496,993 | – | – |
| 2022-W Proof Silver Eagle (Bulk – 40 Coins) | 4,106 | 4,106 | – | – |
| 2021 Reverse Proof American Silver Eagle Two-Coin Set* | 124,917 | 124,917 | – | – |
| 2021-S Proof Silver Eagle, Type 2* | 199,744 | 199,744 | – | – |
| 2021-S Proof Silver Eagle, Type 2 (Bulk – 40 Coins)* | 652 | 652 | – | – |
| 2021-W Proof Silver Eagle, Type 2* | 300,096 | 300,096 | – | – |
| 2021-W Proof Silver Eagle, Type 2 (Bulk – 40 Coins)* | 2,142 | 2,142 | – | – |
| 2021-W Proof Silver Eagle, Type 1* | 299,898 | 299,898 | – | – |
| 2021-W Proof Silver Eagle, Type 1 (Bulk – 40 Coins)* | 686 | 686 | – | – |
Uncirculated Silver Eagles |
||||
| Old Sales |
Latest Sales |
Gain/ Loss |
% Increase |
|
| 2023 | 137,128 | 137,188 | 60 | 0.04% |
| 2022 | 160,107 | 160,106 | -1 | 0.00% |
| 2022 Bulk 40 | 987 | 987 | – | – |
| 2021* | 174,931 | 174,931 | – | – |
| 2021 Bulk 40* | 324 | 324 | – | – |
2023 Proof American Eagle Gold Coins |
||||
| Old Sales |
Latest Sales |
Gain/ Loss |
% Increase |
|
| 1 oz | 6,468 | 6,468 | – | – |
| 1/2 oz | 2,011 | 2,011 | – | – |
| 1/4 oz | 4,490 | 4,490 | – | – |
| 1/10 oz | 13,419 | 13,419 | – | – |
| 4-Coin Set | 9,409 | 9,409 | – | – |
2022 Proof American Eagle Gold Coins |
||||
| Old Sales |
Latest Sales |
Gain/ Loss |
% Increase |
|
| 1 oz | 5,913 | 5,913 | – | – |
| 1/2 oz | 1,970 | 1,970 | – | – |
| 1/4 oz | 4,464 | 4,464 | – | – |
| 1/10 oz | 13,806 | 13,806 | – | – |
| 4-Coin Set | 9,906 | 9,906 | – | – |
Uncirculated American Eagle Gold Coins |
||||
| Old Sales |
Latest Sales |
Gain/ Loss |
% Increase |
|
| 2023 | 6,106 | 6,132 | 26 | 0.43% |
| 2022 | 8,850 | 8,855 | 5 | 0.06% |
| 2021* | 8,963 | 8,963 | – | – |
| 2020* | 6,284 | 6,284 | – | – |
| 2019* | 5,851 | 5,851 | – | – |
Proof American Buffalo Gold Coins |
||||
| Old Sales |
Latest Sales |
Gain/ Loss |
% Increase |
|
| 2023 Proof Gold Buffalo | 14,804 | 14,846 | 42 | 0.28% |
| 2022 Proof Gold Buffalo | 15,943 | 15,943 | – | – |
| 2021 Proof Gold Buffalo* | 16,969 | 16,969 | – | – |
| 2020 Proof Gold Buffalo* | 11,887 | 11,887 | – | – |
| 2019 Proof Gold Buffalo* | 14,844 | 14,844 | – | – |
Barbara Bush First Spouse Gold Coins |
||||
| Old Sales |
Latest Sales |
Gain/ Loss |
% Increase |
|
| 2020-W Proof | 2,957 | 2,960 | 3 | 0.10% |
| 2020-W Uncirculated | 1,967 | 1,967 | – | – |
Proof American Platinum Eagle |
||||
| Old Sales |
Latest Sales |
Gain/ Loss |
% Increase |
|
| 2024 | 3,389 | 3,736 | 347 | 10.24% |
| 2023 | 8,252 | 8,255 | 3 | 0.04% |
| 2022 | 9,941 | 9,941 | – | – |
| 2021 | 9,884 | 9,884 | – | – |
| 2020 | 9,835 | 9,835 | – | – |
| 2019 | 11,268 | 11,268 | – | – |
| 2018 | 16,147 | 16,152 | 5 | 0.03% |
| 2017* | 8,890 | 8,890 | – | – |
American Palladium Eagle |
||||
| Old Sales |
Latest Sales |
Gain/ Loss |
% Increase |
|
| 2023-W Uncirculated | 5,263 | 5,276 | 13 | 0.25% |
| 2022-W Reverse Proof | 7,369 | 7,369 | – | – |
| 2021-W Proof | 5,170 | 5,170 | – | – |
| 2020-W Uncirculated | 9,746 | 9,746 | – | – |
| 2019-W Reverse Proof | 18,834 | 18,839 | 5 | 0.03% |
| 2018-W Proof* | 14,986 | 14,986 | – | – |
Presidential Silver Medals |
||||
| Old Sales |
Latest Sales |
Gain/ Loss |
% Increase |
|
| 2024 Rutherford B. Hayes Presidential Silver Medal | 11,105 | 11,097 | -8 | -0.07% |
| 2023 Ulysses S. Grant Presidential Silver Medal | 13,223 | 13,239 | 16 | 0.12% |
| 2023 Andrew Johnson Presidential Silver Medal | 12,427 | 12,433 | 6 | 0.05% |
| 2023 Abraham Lincoln Presidential Silver Medal | 18,813 | 18,850 | 37 | 0.20% |
| 2023 James Buchanan Presidential Silver Medal | 12,304 | 12,310 | 6 | 0.05% |
| 2021 Franklin Pierce Presidential Silver Medal | 12,567 | 12,572 | 5 | 0.04% |
| 2022 Millard Fillmore Presidential Silver Medal | 12,674 | 12,679 | 5 | 0.04% |
| 2022 Zachary Taylor Presidential Silver Medal | 13,055 | 13,061 | 6 | 0.05% |
| 2022 James Knox Polk Presidential Silver Medal | 13,282 | 13,286 | 4 | 0.03% |
| 2021 John Tyler Presidential Silver Medal | 13,693 | 13,699 | 6 | 0.04% |
| 2021 William Henry Harrison Presidential Silver Medal | 13,637 | 13,642 | 5 | 0.04% |
| 2021 Martin Van Buren Presidential Silver Medal | 13,783 | 13,785 | 2 | 0.01% |
| 2020 Andrew Jackson Presidential Silver Medal | 16,710 | 16,713 | 3 | 0.02% |
| 2019 John Quincy Adams Presidential Silver Medal | 14,867 | 14,871 | 4 | 0.03% |
| 2019 James Monroe Presidential Silver Medal | 15,335 | 15,339 | 4 | 0.03% |
| 2019 James Madison Presidential Silver Medal | 16,968 | 16,971 | 3 | 0.02% |
| 2019 Thomas Jefferson Presidential Silver Medal | 24,350 | 24,357 | 7 | 0.03% |
| 2018 George Washington Presidential Silver Medal | 35,322 | 35,337 | 15 | 0.04% |
| 2018 John Adams Presidential Silver Medal | 23,718 | 23,726 | 8 | 0.03% |
American Innovation Reverse Proof Sets |
||||
| Old Sales |
Latest Sales |
Gain/ Loss |
% Increase |
|
| 2023 | 36,761 | 36,848 | 87 | 0.24% |
| 2022 | 49,509 | 49,583 | 74 | 0.15% |
| 2021 | 49,545 | 49,545 | – | – |
2024 American Innovation Dollars – Illinois |
||||
| Old Sales |
Latest Sales |
Gain/ Loss |
% Increase |
|
| 25-coin roll set (P) | 7,016 | 7,066 | 50 | 0.71% |
| 25-coin roll set (D) | 6,484 | 6,547 | 63 | 0.97% |
| 100-coin bag (P) | 1,618 | 1,643 | 25 | 1.55% |
| 100-coin bag (D) | 1,604 | 1,624 | 20 | 1.25% |
2023 American Innovation Dollars – Mississippi |
||||
| Old Sales |
Latest Sales |
Gain/ Loss |
% Increase |
|
| 25-coin roll set (P) | 7,770 | 7,790 | 20 | 0.26% |
| 25-coin roll set (D) | 6,871 | 6,871 | – | – |
| 100-coin bag (P) | 2,099 | 2,104 | 5 | 0.24% |
| 100-coin bag (D) | 2,145 | 2,153 | 8 | 0.37% |
2023 American Innovation Dollars – Indiana |
||||
| Old Sales |
Latest Sales |
Gain/ Loss |
% Increase |
|
| 25-coin roll set (P) | 8,022 | 8,022 | – | – |
| 25-coin roll set (D) | 6,995 | 6,995 | – | – |
| 100-coin bag (P) | 3,004 | 3,004 | – | – |
| 100-coin bag (D) | 2,777 | 2,777 | – | – |
2023 American Innovation Dollars – Louisiana |
||||
| Old Sales |
Latest Sales |
Gain/ Loss |
% Increase |
|
| 25-coin roll set (P) | 7,989 | 7,989 | – | – |
| 25-coin roll set (D) | 6,989 | 6,989 | – | – |
| 100-coin bag (P) | 2,680 | 2,682 | 2 | 0.07% |
| 100-coin bag (D) | 2,578 | 2,585 | 7 | 0.27% |
2023 American Innovation Dollars – Ohio |
||||
| Old Sales |
Latest Sales |
Gain/ Loss |
% Increase |
|
| 25-coin roll set (P) | 8,016 | 8,016 | – | – |
| 25-coin roll set (D) | 6,978 | 6,978 | – | – |
| 100-coin bag (P) | 2,959 | 2,959 | – | – |
| 100-coin bag (D) | 2,739 | 2,739 | – | – |
2022 American Innovation Dollars – Tennessee |
||||
| Old Sales |
Latest Sales |
Gain/ Loss |
% Increase |
|
| 25-coin roll set (P) | 7,013 | 7,013 | – | – |
| 25-coin roll set (D) | 7,010 | 7,010 | – | – |
| 100-coin bag (P) | 2,781 | 2,781 | – | – |
| 100-coin bag (D) | 2,786 | 2,786 | – | – |
2022 American Innovation Dollars – Kentucky |
||||
| Old Sales |
Latest Sales |
Gain/ Loss |
% Increase |
|
| 25-coin roll set (P) | 7,009 | 7,009 | – | – |
| 25-coin roll set (D) | 6,993 | 6,993 | – | – |
| 100-coin bag (P) | 2,771 | 2,771 | – | – |
| 100-coin bag (D) | 2,779 | 2,779 | – | – |
2022 American Innovation Dollars – Vermont |
||||
| Old Sales |
Latest Sales |
Gain/ Loss |
% Increase |
|
| 25-coin roll set (P) | 7,023 | 7,023 | – | – |
| 25-coin roll set (D) | 7,011 | 7,011 | – | – |
| 100-coin bag (P) | 2,787 | 2,787 | – | – |
| 100-coin bag (D) | 2,778 | 2,778 | – | – |
2022 American Innovation Dollars – Rhode Island |
||||
| Old Sales |
Latest Sales |
Gain/ Loss |
% Increase |
|
| 25-coin roll set (P) | 7,010 | 7,010 | – | – |
| 25-coin roll set (D) | 7,007 | 7,007 | – | – |
| 100-coin bag (P) | 2,789 | 2,789 | – | – |
| 100-coin bag (D) | 2,787 | 2,787 | – | – |
2021 American Innovation Dollars – North Carolina |
||||
| Old Sales |
Latest Sales |
Gain/ Loss |
% Increase |
|
| 25-coin roll set (P) | 7,010 | 7,010 | – | – |
| 25-coin roll set (D) | 7,018 | 7,018 | – | – |
| 100-coin bag (P) | 2,789 | 2,789 | – | – |
| 100-coin bag (D) | 2,790 | 2,790 | – | – |
2021 American Innovation Dollars – New York |
||||
| Old Sales |
Latest Sales |
Gain/
Loss |
% Increase |
|
| 25-coin roll set (P) | 7,006 | 7,006 | – | – |
| 25-coin roll set (D) | 7,013 | 7,013 | – | – |
| 100-coin bag (P) | 2,786 | 2,786 | – | – |
| 100-coin bag (D) | 2,785 | 2,785 | – | – |
2021 American Innovation Dollars – Virginia |
||||
| Old Sales |
Latest Sales |
Gain/ Loss |
% Increase |
|
| 25-coin roll set (P) | 7,015 | 7,015 | – | – |
| 25-coin roll set (D) | 7,010 | 7,010 | – | – |
| 100-coin bag (P) | 2,796 | 2,796 | – | – |
| 100-coin bag (D) | 2,786 | 2,786 | – | – |
2021 American Innovation Dollars – New Hampshire |
||||
| Old Sales |
Latest Sales |
Gain/ Loss |
% Increase |
|
| 25-coin roll set (P) | 7,017 | 7,017 | – | – |
| 25-coin roll set (D) | 7,017 | 7,017 | – | – |
| 100-coin bag (P) | 2,789 | 2,789 | – | – |
| 100-coin bag (D) | 2,790 | 2,790 | – | – |
2020 American Innovation Dollars – South Carolina |
||||
| Old Sales |
Latest Sales |
Gain/ Loss |
% Increase |
|
| Reverse Proof (S) | 41,466 | 41,472 | 6 | 0.01% |
| 25-coin roll set (P) | 6,378 | 6,378 | – | – |
| 25-coin roll set (D) | 6,399 | 6,399 | – | – |
| 100-coin bag (P) | 2,734 | 2,734 | – | – |
| 100-coin bag (D) | 2,378 | 2,378 | – | – |
2020 American Innovation Dollars – Maryland |
||||
| Old Sales |
Latest Sales |
Gain/ Loss |
% Increase |
|
| Reverse Proof (S) | 49,794 | 49,794 | – | – |
| 25-coin roll set (P) | 6,493 | 6,493 | – | – |
| 25-coin roll set (D) | 6,471 | 6,471 | – | – |
| 100-coin bag (P) | 2,725 | 2,725 | – | – |
| 100-coin bag (D) | 2,737 | 2,737 | – | – |
2020 American Innovation Dollars – Massachusetts |
||||
| Old Sales |
Latest Sales |
Gain/ Loss |
% Increase |
|
| Reverse Proof (S) | 49,297 | 49,314 | 17 | 0.03% |
| 25-coin roll set (P) | 6,486 | 6,486 | – | – |
| 25-coin roll set (D) | 6,481 | 6,481 | – | – |
| 100-coin bag (P) | 2,746 | 2,746 | – | – |
| 100-coin bag (D) | 2,744 | 2,744 | – | – |
2020 American Innovation Dollars – Connecticut |
||||
| Old Sales |
Latest Sales |
Gain/ Loss |
% Increase |
|
| Reverse Proof (S) | 46,857 | 46,903 | 46 | 0.10% |
| 25-coin roll set (P) | 6,496 | 6,496 | – | – |
| 25-coin roll set (D) | 6,425 | 6,425 | – | – |
| 100-coin bag (P) | 2,736 | 2,736 | – | – |
| 100-coin bag (D) | 2,747 | 2,747 | – | – |
2019 American Innovation Dollars – Georgia |
||||
| Old Sales |
Latest Sales |
Gain/ Loss |
% Increase |
|
| Reverse Proof (S) | 47,238 | 47,260 | 22 | 0.05% |
| 25-coin roll set (P) | 8,060 | 8,072 | 12 | 0.15% |
| 25-coin roll set (D) | 7,521 | 7,533 | 12 | 0.16% |
| 100-coin bag (P) | 3,455 | 3,456 | 1 | 0.03% |
| 100-coin bag (D) | 3,317 | 3,318 | 1 | 0.03% |
2019 American Innovation Dollars – New Jersey |
||||
| Old Sales |
Latest Sales |
Gain/ Loss |
% Increase |
|
| Reverse Proof (S) | 50,649 | 50,688 | 39 | 0.08% |
| 25-coin roll set (P) | 9,062 | 9,076 | 14 | 0.15% |
| 25-coin roll set (D) | 8,015 | 8,025 | 10 | 0.12% |
| 100-coin bag (P) | 3,931 | 3,938 | 7 | 0.18% |
| 100-coin bag (D) | 3,573 | 3,575 | 2 | 0.06% |
2019 American Innovation Dollars – Pennsylvania |
||||
| Old Sales |
Latest Sales |
Gain/ Loss |
% Increase |
|
| Reverse Proof (S) | 55,184 | 55,203 | 19 | 0.03% |
| 25-coin roll set (P) | 10,414 | 10,432 | 18 | 0.17% |
| 25-coin roll set (D) | 8,510 | 8,521 | 11 | 0.13% |
| 100-coin bag (P) | 3,666 | 3,675 | 9 | 0.25% |
| 100-coin bag (D) | 3,048 | 3,051 | 3 | 0.10% |
2019 American Innovation Dollars – Delaware |
||||
| Old Sales |
Latest Sales |
Gain/ Loss |
% Increase |
|
| Reverse Proof (S) | 70,684 | 70,701 | 17 | 0.02% |
| 25-coin roll set (P) | 9,079 | 9,088 | 9 | 0.10% |
| 25-coin roll set (D) | 8,356 | 8,362 | 6 | 0.07% |
| 100-coin bag (P) | 3,198 | 3,200 | 2 | 0.06% |
| 100-coin bag (D) | 3,383 | 3,385 | 2 | 0.06% |
2018 American Innovation Dollars |
||||
| Old Sales |
Latest Sales |
Gain/ Loss |
% Increase |
|
| Reverse Proof (S)* | 74,720 | 74,720 | – | – |
| Proof Coin (S) | 253,891 | 254,004 | 113 | 0.04% |
| 25-coin roll set (P) | 22,844 | 22,873 | 29 | 0.13% |
| 25-coin roll set (D) | 25,687 | 25,705 | 18 | 0.07% |
| 100-coin bag (P)* | 2,935 | 2,935 | – | – |
| 100-coin bag (D)* | 2,954 | 2,954 | – | – |
George H.W. Bush Coin & Chronicles Set |
||||
| Old Sales |
Latest Sales |
Gain/ Loss |
% Increase |
|
| $1 Coin & Set | 11,490 | 11,494 | 4 | 0.03% |
2020 Bush Presidential $1 Coin & First Spouse Medal Set |
||||
| Old Sales |
Latest Sales |
Gain/ Loss |
% Increase |
|
| $1 Coin & Set | 9,876 | 9,876 | – | – |
2020 George H.W. Bush Presidential $1 Coins |
||||
| Old Sales |
Latest Sales |
Gain/ Loss |
% Increase |
|
| 25-coin roll (P) | 24,922 | 24,922 | – | – |
| 25-coin roll (D) | 23,105 | 23,132 | 27 | 0.12% |
| 100-coin bag (P) | 2,695 | 2,695 | – | – |
| 100-coin bag (D) | 2,098 | 2,098 | – | – |
| 250-coin bag (P) | 2,968 | 2,968 | – | – |
| 250-coin bag (D) | 4,530 | 4,554 | 24 | 0.53% |
Native American Dollar Rolls |
||||
| Old Sales |
Latest Sales |
Gain/ Loss |
% Increase |
|
| 2024-P Native American $1 25 Coin Roll | 10,386 | 10,554 | 168 | 1.62% |
| 2024-D Native American $1 25 Coin Roll | 10,322 | 10,453 | 131 | 1.27% |
| 2024-P Native American $1 100-Coin Bag | 1,417 | 1,460 | 43 | 3.03% |
| 2024-D Native American $1 100-Coin Bag | 1,294 | 1,327 | 33 | 2.55% |
| 2024-P Native American $1 250-Coin Box | 667 | 689 | 22 | 3.30% |
| 2024-D Native American $1 250-Coin Box | 745 | 766 | 21 | 2.82% |
| 2023-P Native American $1 25 Coin Roll | 13,917 | 13,917 | – | – |
| 2023-D Native American $1 25 Coin Roll | 13,944 | 13,944 | – | – |
| 2023-P Native American $1 100-Coin Bag | 1,695 | 1,695 | – | – |
| 2023-D Native American $1 100-Coin Bag | 1,694 | 1,694 | – | – |
| 2023-P Native American $1 250-Coin Box | 1,437 | 1,450 | 13 | 0.90% |
| 2023-D Native American $1 250-Coin Box | 1,584 | 1,592 | 8 | 0.51% |
| 2022-P Native American $1 25 Coin Roll | 13,996 | 13,996 | – | – |
| 2022-D Native American $1 25 Coin Roll | 13,964 | 13,964 | – | – |
| 2022-P Native American $1 100-Coin Bag | 1,699 | 1,699 | – | – |
| 2022-D Native American $1 100-Coin Bag | 1,613 | 1,613 | – | – |
| 2022-P Native American $1 250-Coin Box | 1,698 | 1,698 | – | – |
| 2022-D Native American $1 250-Coin Box | 1,699 | 1,699 | – | – |
Kennedy Half Dollar Rolls |
||||
| Old Sales |
Latest Sales |
Gain/ Loss |
% Increase |
|
| 2023-dated 200-coin bag (P&D) | 11,146 | 11,146 | – | – |
| 2023-dated 2-roll set (P&D) | 24,987 | 24,987 | – | – |
| 2022-dated 200-coin bag (P&D) | 10,999 | 10,999 | – | – |
| 2022-dated 2-roll set (P&D) | 21,926 | 21,926 | – | – |
| 2021-dated 200-coin bag (P&D)* | 9,976 | 9,976 | – | – |
| 2021-dated 2-roll set (P&D)* | 21,989 | 21,989 | – | – |
| 2020-dated 200-coin bag (P&D)* | 11,776 | 11,776 | – | – |
| 2020-dated 2-roll set (P&D)* | 24,312 | 24,312 | – | – |
| 2019-dated 200-coin bag (P&D)* | 11,534 | 11,534 | – | – |
| 2019-dated 2-roll set (P&D)* | 24,132 | 24,132 | – | – |
2024 Rev. Dr. Pauli Murray Quarters |
||||
| Old Sales |
Latest Sales |
Gain/ Loss |
% Increase |
|
| Three-Roll Set | 11,353 | 11,396 | 43 | 0.38% |
| 100-Coin Bag (P) | 1,511 | 1,524 | 13 | 0.86% |
| 100-Coin Bag (D) | 1,284 | 1,297 | 13 | 1.01% |
| Two-Roll Set | 2,653 | 2,665 | 12 | 0.45% |
2023 Maria Tallchief Quarters |
||||
| Old Sales |
Latest Sales |
Gain/ Loss |
% Increase |
|
| Three-Roll Set | 12,378 | 12,405 | 27 | 0.22% |
| 100-Coin Bag (P) | 1,871 | 1,880 | 9 | 0.48% |
| 100-Coin Bag (D) | 1,673 | 1,677 | 4 | 0.24% |
| Two-Roll Set | 3,325 | 3,337 | 12 | 0.36% |
2023 Jovita Idar Quarters |
||||
| Old Sales |
Latest Sales |
Gain/ Loss |
% Increase |
|
| Three-Roll Set | 12,583 | 12,583 | – | – |
| 100-Coin Bag (P) | 3,857 | 3,862 | 5 | 0.13% |
| 100-Coin Bag (D) | 3,515 | 3,521 | 6 | 0.17% |
| Two-Roll Set | 3,661 | 3,676 | 15 | 0.41% |
2023 Eleanor Roosevelt Quarters |
||||
| Old Sales |
Latest Sales |
Gain/ Loss |
% Increase |
|
| Three-Roll Set | 12,678 | 12,678 | – | – |
| 100-Coin Bag (P) | 4,226 | 4,231 | 5 | 0.12% |
| 100-Coin Bag (D) | 3,920 | 3,921 | 1 | 0.03% |
| Two-Roll Set | 4,388 | 4,392 | 4 | 0.09% |
2023 Edith Kanakaʻole Quarters |
||||
| Old Sales |
Latest Sales |
Gain/ Loss |
% Increase |
|
| Three-Roll Set | 12,585 | 12,585 | – | – |
| 100-Coin Bag (P) | 7,157 | 7,165 | 8 | 0.11% |
| 100-Coin Bag (D) | 4,503 | 4,509 | 6 | 0.13% |
| Two-Roll Set | 5,610 | 5,613 | 3 | 0.05% |
2023 Bessie Coleman Quarters |
||||
| Old Sales |
Latest Sales |
Gain/ Loss |
% Increase |
|
| Three-Roll Set | 12,509 | 12,509 | – | – |
| 100-Coin Bag (P) | 5,535 | 5,537 | 2 | 0.04% |
| 100-Coin Bag (D) | 4,876 | 4,878 | 2 | 0.04% |
| Two-Roll Set | 5,761 | 5,768 | 7 | 0.12% |
2022 Anna May Wong Quarters |
||||
| Old Sales |
Latest Sales |
Gain/ Loss |
% Increase |
|
| Three-Roll Set | 7,617 | 7,617 | – | – |
| 100-Coin Bag (P) | 1,860 | 1,860 | – | – |
| 100-Coin Bag (D) | 1,858 | 1,858 | – | – |
| Two-Roll Set | 5,936 | 5,936 | – | – |
2022 Nina Otero-Warren Quarters |
||||
| Old Sales |
Latest Sales |
Gain/ Loss |
% Increase |
|
| Three-Roll Set | 7,639 | 7,639 | – | – |
| 100-Coin Bag (P) | 1,856 | 1,856 | – | – |
| 100-Coin Bag (D) | 1,855 | 1,855 | – | – |
| Two-Roll Set | 5,888 | 5,888 | – | – |
2022 Wilma Mankiller Quarters |
||||
| Old Sales |
Latest Sales |
Gain/ Loss |
% Increase |
|
| Three-Roll Set | 7,616 | 7,616 | – | – |
| 100-Coin Bag (P) | 1,852 | 1,852 | – | – |
| 100-Coin Bag (D) | 1,831 | 1,831 | – | – |
| Two-Roll Set | 5,918 | 5,918 | – | – |
2022 Dr. Sally Ride Quarters |
||||
| Old Sales |
Latest Sales |
Gain/ Loss |
% Increase |
|
| Three-Roll Set | 7,603 | 7,603 | – | – |
| 100-Coin Bag (P) | 1,854 | 1,854 | – | – |
| 100-Coin Bag (D) | 1,852 | 1,852 | – | – |
| Two-Roll Set | 5,926 | 5,926 | – | – |
2022 Maya Angelou Quarters |
||||
| Old Sales |
Latest Sales |
Gain/ Loss |
% Increase |
|
| Three-Roll Set | 7,588 | 7,588 | – | – |
| 100-Coin Bag (P) | 1,858 | 1,858 | – | – |
| 100-Coin Bag (D) | 1,861 | 1,861 | – | – |
| Two-Roll Set | 5,940 | 5,940 | – | – |


