The pace of striking U.S. coins for circulation was quick in 2021 but down from 2020, production figures from the United States Mint show.
U.S. minting facilities shipped nearly 14.5 billion coins to Federal Reserve Banks for release into circulation in calendar year 2021, dipping 1.9% from the over 14.7 billion coins made in 2020 when production was ramped up to alleviate coin circulation issues brought on by the COVID-19 pandemic.
Here is a summary of U.S. coin production totals in 2021 compared to those from 2020:
US Mint Annual Coin Production (2021 vs 2020)
| Year 2020 | Year 2021 | 2021 Unit Gain / Loss | 2021 % Gain / Loss | |
|---|---|---|---|---|
| Cents | 7,596,400,000 | 7,908,620,000 | 312,220,000 | 4.1% |
| Nickels | 1,623,100,000 | 1,570,780,000 | -52,320,000 | -3.2% |
| Dimes | 2,778,500,000 | 2,830,250,000 | 51,750,000 | 1.9% |
| Quarters | 2,768,000,000 | 2,168,200,000 | -599,800,000 | -21.7% |
| Half Dollars | 5,700,000 | 13,100,000 | 7,400,000 | 129.8% |
| Native American $1 | 2,660,000 | 2,520,000 | -140,000 | -5.3% |
| Total | 14,774,360,000 | 14,493,470,000 | -280,890,000 | -1.9% |
U.S. Mint plants in Philadelphia and Denver manufacture all of America’s coins for commerce. In 2021, the Philadelphia Mint made 7,053,310,000 coins while the Denver Mint made 7,440,160,000 coins.
Mintages of Kennedy half-dollars and Native American dollars are lower than other coins because the Federal Reserve no longer orders them for circulation (or rarely does in the case of halves). Dollar coins (and usually half dollars) are produced only for U.S. Mint collectible sales.
Reported mintages for 2021 Kennedy half-dollars totaled 13.1 million with splits of 7.7 million from Denver and 5.4 million from Philadelphia. Marking an unusual year for halves, most of them were actually ordered by the Federal Reserve for circulation. As a comparison, 2020-dated half dollars ended at 3.4 million from Denver and 2.3 million from Philadelphia for a combined 5.7 million coins. Mint fiscal year data shows 12 million halves shipped to Federal Reserve Banks in 2021 against zero in 2020. (The Mint’s fiscal year begins on Oct. 1 and ends on Sept. 30. Outside of the 12 million halves just mentioned, all other data presented in this article is for calendar year 2021.)
Mintages of 2021 Native American dollars ended with equal splits of 1.26 million from Denver and 1.26 million from Philadelphia for a combined 2.52 million coins. In contrast, the 2020 dollar saw 1.26 million for Denver and 1.4 million for Philadelphia for 2.66 million coins.
The Federal Reserve orders more 1-cent coins from the U.S. Mint than any other denomination even as data shows that it costs 2.1 cents to make and distribute each one. The over 7.9 billion cents struck last year represents 54.6% of the combined production total for 2021. In 2020, the Mint manufactured nearly 7.6 billion cents for 51.4% of all coins minted for circulation.
This next table shows 2021 circulating coin mintages by production facility, denomination, and design.
2021 Circulating Coin Production by Design
| Denver | Philadelphia | Total | |
|---|---|---|---|
| Lincoln Cent | 3,982,800,000 | 3,925,820,000 | 7,908,620,000 |
| Jefferson Nickel | 798,000,000 | 772,780,000 | 1,570,780,000 |
| Roosevelt Dime | 1,481,000,000 | 1,349,250,000 | 2,830,250,000 |
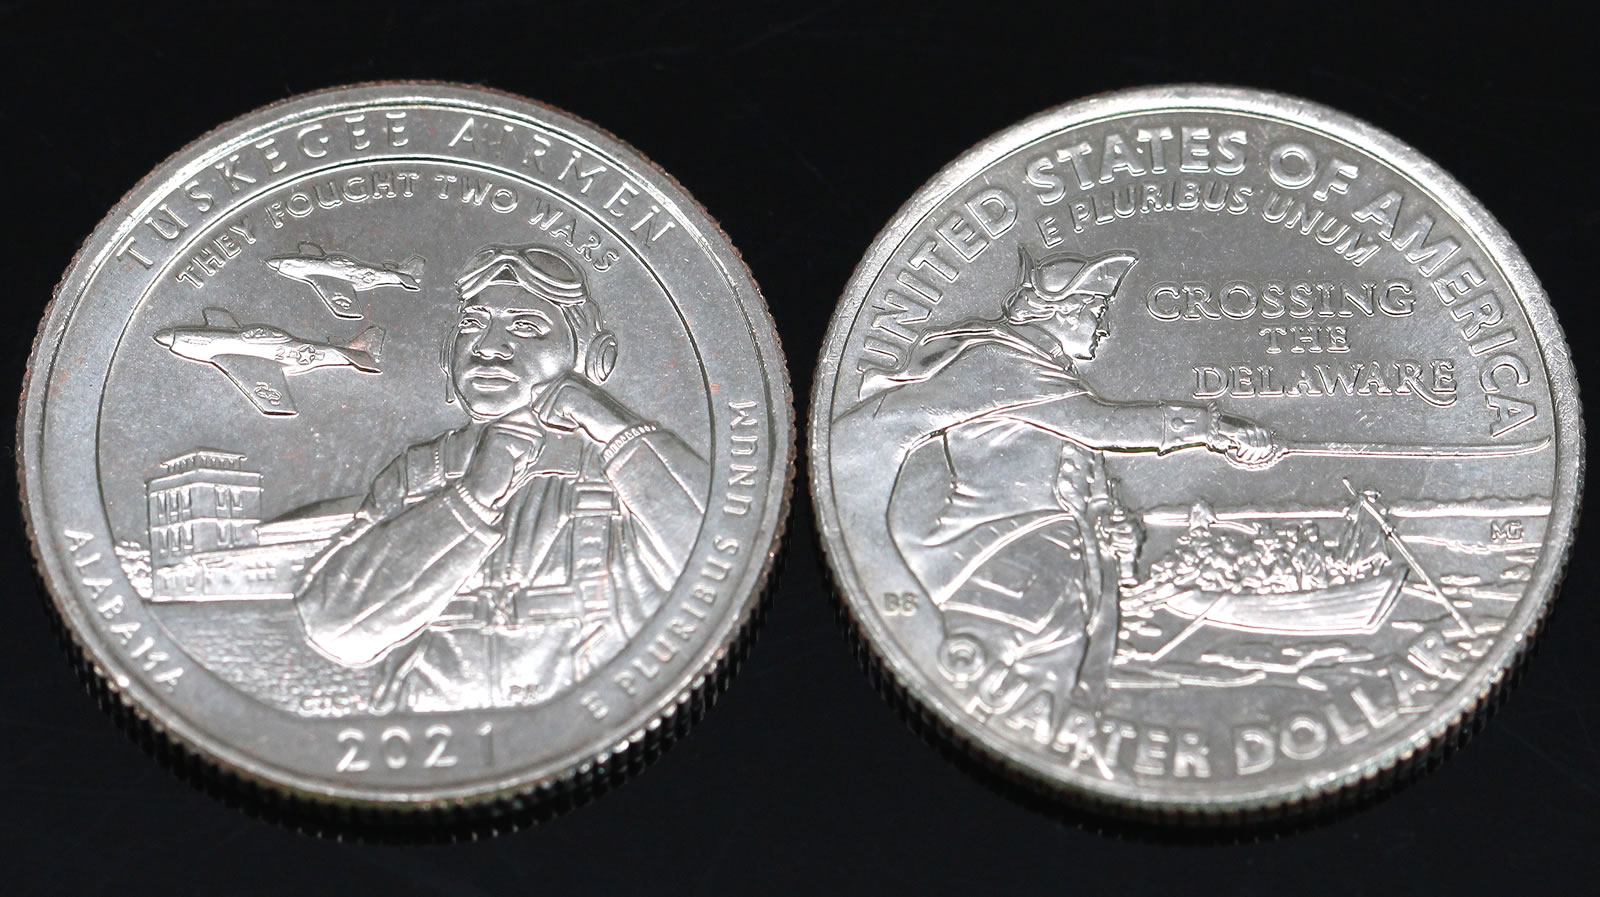
| Tuskegee Airmen National Historic Site Quarter (Alabama) | 304,000,000 | 160,400,000 | 464,400,000 |
| George Washington Crossing the Delaware Quarter | 865,400,000 | 838,400,000 | 1,703,800,000 |
| Kennedy Half-Dollar | 7,700,000 | 5,400,000 | 13,100,000 |
| Native American $1 Coin | 1,260,000 | 1,260,000 | 2,520,000 |
| Total | 7,440,160,000 | 7,053,310,000 | 14,493,470,000 |
Final America the Beautiful Quarter Mintages
The U.S. Mint’s program of America the Beautiful Quarters® ended in early 2021 with the final release — the 2021 Tuskegee Airmen quarter for Alabama. It ended with mintages of 304 million from Denver and 160.4 million from Philadelphia for a combined 464.4 million.
Fifty-six unique America the Beautiful quarter designs were released from 2010 to 2021.
The 2016 Harpers Ferry National Historical quarter for West Virginia is the series’ mintage leader at 858.63 million while the 2012 Chaco Culture National Historical Park quarter for New Mexico ended at the bottom of the pack with 44 million.
The scarcest America the Beautiful quarter dollar by production facility is the Denver Mint-struck 2012-D Acadia National Park quarter at 21.6 million. The ‘P’ and ‘D’ Chaco Culture quarters follow with each at 22 million.
Aside from 2021, five unique America the Beautiful designs were issued in each year of the program. Combined ATB quarter mintages by year include:
- 347 million in 2010,
- 391.2 million in 2011,
- 568 million in 2012,
- 1.455 billion in 2013,
- 1.58 billion in 2014,
- 2.99 billion in 2015,
- 2.35 billion in 2016,
- 2.11 billion in 2017
- 1.85 billion in 2018,
- 1.6516 billion in 2019,
- 2.768 billion in 2020, and
- 464.4 million in 2021.
Overall, the U.S. Mint struck over 18.5 billion America the Beautiful Quarters with each celebrating a different national park or national site in the United States or its territories. Here is a breakdown of production totals by quarter design and coin production facility:
2010 – 2021 America the Beautiful Quarters Mintages
| Denver | Philadelphia | Total | |
|---|---|---|---|
| 2010 Hot Springs National Park | 34,000,000 | 35,600,000 | 69,600,000 |
| 2010 Yellowstone National Park | 34,800,000 | 33,600,000 | 68,400,000 |
| 2010 Yosemite National Park | 34,800,000 | 35,200,000 | 70,000,000 |
| 2010 Grand Canyon National Park | 35,400,000 | 34,800,000 | 70,200,000 |
| 2010 Mount Hood National Forest | 34,400,000 | 34,400,000 | 68,800,000 |
| 2011 Gettysburg National Military Park | 30,400,000 | 30,800,000 | 61,200,000 |
| 2011 Glacier National Park | 31,200,000 | 30,400,000 | 61,600,000 |
| 2011 Olympic National Park | 30,600,000 | 30,400,000 | 61,000,000 |
| 2011 Vicksburg National Military Park | 33,400,000 | 30,800,000 | 64,200,000 |
| 2011 Chickasaw National Recreation Area | 69,400,000 | 73,800,000 | 143,200,000 |
| 2012 El Yunque Quarter | 25,000,000 | 25,800,000 | 50,800,000 |
| 2012 Chaco Culture Quarter | 22,000,000 | 22,000,000 | 44,000,000 |
| 2012 Acadia Quarter | 21,606,000 | 24,800,000 | 46,406,000 |
| 2012 Hawaii Quarter | 78,600,000 | 46,200,000 | 124,800,000 |
| 2012 Denali Quarter | 166,600,000 | 135,400,000 | 302,000,000 |
| 2013 White Mountain Quarter | 107,600,000 | 68,800,000 | 176,400,000 |
| 2013 Perry’s Victory Quarter | 131,600,000 | 107,800,000 | 239,400,000 |
| 2013 Great Basin Quarter | 141,400,000 | 122,400,000 | 263,800,000 |
| 2013 Fort McHenry Quarter | 151,400,000 | 120,000,000 | 271,400,000 |
| 2013 Mount Rushmore Quarter | 272,400,000 | 231,800,000 | 504,200,000 |
| 2014 Great Smoky Mountains Quarter | 99,400,000 | 73,200,000 | 172,600,000 |
| 2014 Shenandoah National Park Quarter | 197,800,000 | 112,800,000 | 310,600,000 |
| 2014 Arches National Park Quarter | 251,400,000 | 214,200,000 | 465,600,000 |
| 2014 Great Sand Dunes Quarter | 171,800,000 | 159,600,000 | 331,400,000 |
| 2014 Everglades National Park Quarter | 142,400,000 | 157,601,200 | 300,001,200 |
| 2015 Homestead National Monument of America Quarter | 248,600,000 | 214,400,000 | 463,000,000 |
| 2015 Kisatchie National Forest Quarter | 379,600,000 | 397,200,000 | 776,800,000 |
| 2015 Blue Ridge Parkway Quarter | 505,200,000 | 325,616,000 | 830,816,000 |
| 2015 Bombay Hook National Wildlife Refuge Quarter | 206,400,000 | 275,000,000 | 481,400,000 |
| 2015 Saratoga National Historical Park Quarter | 215,800,000 | 223,000,000 | 438,800,000 |
| 2016 Shawnee National Forest Quarter | 151,800,000 | 155,600,000 | 307,400,000 |
| 2016 Cumberland Gap National Historical Park Quarter | 223,200,000 | 215,400,000 | 438,600,000 |
| 2016 Harpers Ferry National Historical Park Quarter | 424,000,000 | 434,630,000 | 858,630,000 |
| 2016 Theodore Roosevelt National Park Quarter | 223,200,000 | 231,600,000 | 454,800,000 |
| 2016 Fort Moultrie Quarter | 142,200,000 | 154,400,000 | 296,600,000 |
| 2017 Effigy Mounds National Monument Quarter | 210,800,000 | 271,200,000 | 482,000,000 |
| 2017 Frederick Douglass National Historic Site Quarter | 185,800,000 | 184,800,000 | 370,600,000 |
| 2017 Ozark National Scenic Riverways Quarter | 200,000,000 | 203,000,000 | 403,000,000 |
| 2017 Ellis Island National Monument Quarter | 254,000,000 | 234,000,000 | 488,000,000 |
| 2017 George Rogers Clark National Historical Park Quarter | 180,800,000 | 191,600,000 | 372,400,000 |
| 2018 Pictured Rocks National Lakeshore Quarter (MI) | 182,600,000 | 186,714,000 | 369,314,000 |
| 2018 Apostle Islands National Lakeshore Quarter (WI) | 216,600,000 | 223,200,000 | 439,800,000 |
| 2018 Voyageurs National Park Quarter (MN) | 197,800,000 | 237,400,000 | 435,200,000 |
| 2018 Cumberland Island National Seashore Quarter (GA) | 151,600,000 | 138,000,000 | 289,600,000 |
| 2018 Block Island National Wildlife Refuge Quarter (RI) | 159,600,000 | 159,600,000 | 319,200,000 |
| 2019 Lowell National Historical Park Quarter (MA) | 182,200,000 | 165,800,000 | 348,000,000 |
| 2019 American Memorial Park Quarter (MP) | 182,600,000 | 142,800,000 | 325,400,000 |
| 2019 War in the Pacific National Historical Park Quarter (GU) | 114,400,000 | 116,600,000 | 231,000,000 |
| 2019 San Antonio Missions National Historical Park Quarter (TX) | 129,400,000 | 142,800,000 | 272,200,000 |
| 2019 Frank Church River of No Return Wilderness Quarter (ID) | 251,600,000 | 223,400,000 | 475,000,000 |
| 2020 National Park of American Samoa Quarter (AS) | 212,200,000 | 286,000,000 | 498,200,000 |
| 2020 Weir Farm National Historic Site Quarter (CY) | 155,000,000 | 125,600,000 | 280,600,000 |
| 2020 Salt River Bay National Historical Park and Ecological Preserve Quarter (USVI) | 515,000,000 | 580,200,000 | 1,095,200,000 |
| 2020 Marsh-Billings-Rockefeller National Historical Park Quarter (VT) | 345,800,000 | 304,600,000 | 650,400,000 |
| 2020 Tallgrass Prairie National Preserve Quarter (KS) | 142,400,000 | 101,200,000 | 243,600,000 |
| 2021 Tuskegee Airmen National Historic Site Quarter (AL) | 304,000,000 | 160,400,000 | 464,400,000 |
| Total | 9,543,606,000 | 8,997,961,200 | 18,541,567,200 |
2021 George Washington Crossing the Delaware Quarter Mintages
Last year the U.S. Mint also issued the George Washington Crossing the Delaware quarter. It turned out to be, in essence, a transition quarter circulated after the last America the Beautiful Quarter and before the first 2022 American Women quarters.
Circulating mintages for the 2021 George Washington Crossing the Delaware quarter register high at 865.4 million from Denver and 838.4 million from Philadelphia for a combined 1,703,800,000.
Coin Production in December 2021
Normally, December is a significantly slower production month as the U.S. Mint adjusts their tooling for the upcoming year’s coins. That has not been the case in the last two Decembers with solid amounts of 953.37 million coins in December 2021 and 903.50 million coins in December 2020.
More typical Decembers are represented in years 2011 to 2019, for example, with their totals of 431.78 million, 245.34 million, 285.96 million, 878.84 million, 707.79 million, 696.68 million, 762.86 million, 560.64 million, and 400.88 million.
Here’s how last month compares against others in the past year:
December 2020 to December 2021 Circulating Coin Production
| Month | Mintages | Rank |
|---|---|---|
| December 2021 | 953.37 M | 11 |
| November 2021 | 1,104.7 M | 10 |
| October 2021 | 1,213.86 M | 5 |
| September 2021 | 1,169.28 M | 7 |
| August 2021 | 1,187.32 M | 6 |
| July 2021 | 1,505.24 M | 1 |
| June 2021 | 1,348.60 M | 3 |
| May 2021 | 1,473.06 M | 2 |
| April 2021 | 1,320.28 M | 4 |
| March 2021 | 1,134.84 M | 9 |
| February 2021 | 1,163.40 M | 8 |
| January 2021 | 919.52 M | 12 |
| December 2020 | 903.50 M | 13 |
This last table shows productions totals by denomination for December:
US Mint Circulating Coin Production in December 2021
| Denomination | Denver | Philadelphia | Total |
|---|---|---|---|
| Lincoln Cents | 315,600,000 | 288,220,000 | 603,820,000 |
| Jefferson Nickels | 27,120,000 | 41,280,000 | 68,400,000 |
| Roosevelt Dimes | 69,500,000 | 72,250,000 | 141,750,000 |
| Quarters | 72,200,000 | 67,200,000 | 139,400,000 |
| Kennedy Half Dollars | 0 | 0 | 0 |
| Native American $1s | 0 | 0 | 0 |
| Total | 484,420,000 | 468,950,000 | 953,370,000 |


