The United States Mint last week introduced three products — a set of quarters recognizing Tallgrass Prairie National Preserve in Kansas and two limited-edition American Eagle coins marking the 75th anniversary of the Second World War. The latest batch of U.S. Mint sales stats show their totals through Nov. 8.
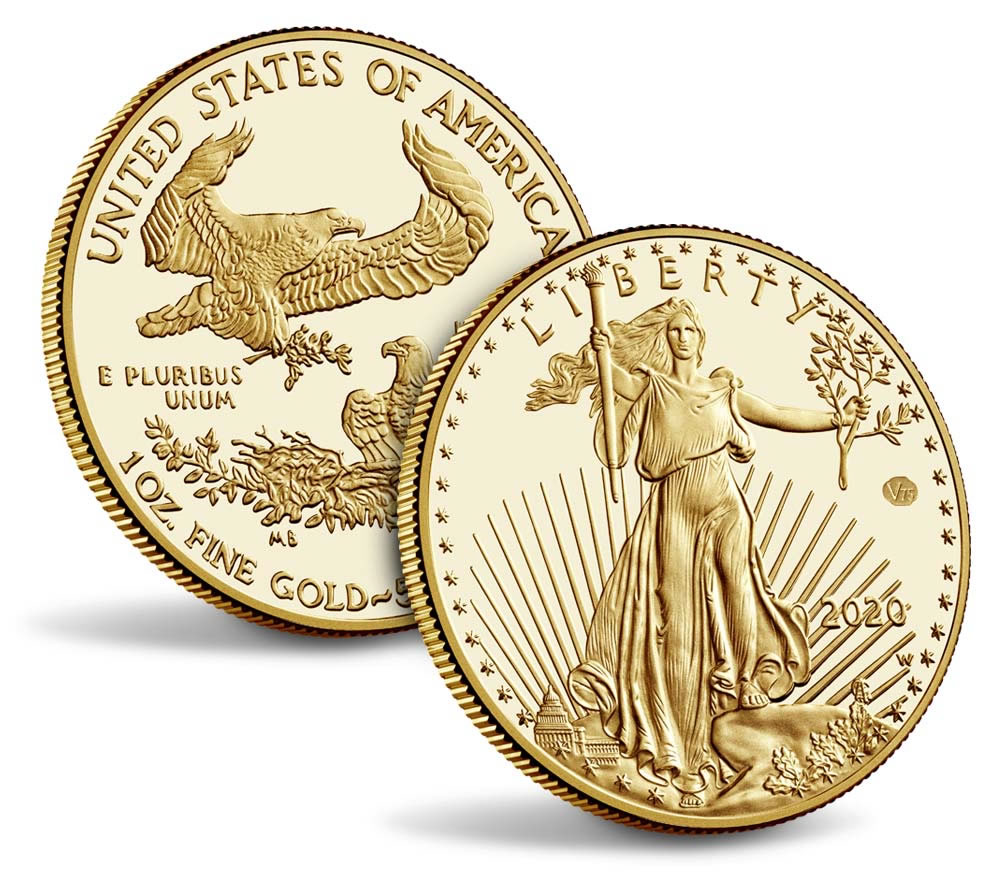
Released Thursday, Nov. 5, the pair of anniversary American Eagles weren’t available for long due to their low mintages and exceptionally high demand. The Mint noted the "coins resulted in the highest website traffic" they have ever experienced.
The American Gold Eagle at $2,600 was available for 7 minutes and the American Silver Eagle at $83 lasted for about 90 minutes. Mint figures have sales of the former at 1,829 of 1,945 and those of the latter at 74,242 of 75,000.
Also released Thursday, the three-coin set of 2020 Tallgrass Prairie quarters contains uncirculated quarters from the Philadelphia and Denver Mints and a proof quarter from the San Francisco Mint. Priced at $11.50, the set registered four-day sales of 11,181.
Weekly U.S. Mint Top Sellers
Here’s the listing of the U.S. Mint’s most popular numismatic products for the week ending Nov. 8:
- 2020-W End of WWII Proof American Silver Eagle (+74,242)
- 2020 Tallgrass Prairie Quarter Three-Coin Set (+11,181)
- 2020 Proof Set (+10,423 to 409,449)
- 2020 American Innovation Dollar Proof Set (+3,708 to 58,645)
- 2020 Silver Proof Set (+3,219 to 296,503)
- 2020 $50 End of WWII Proof American Gold Eagle (+1,829)
- 2019 Proof Set (+1,553 to 591,772)
- 2020 Quarters Circulating Coin Set (+1,117 to 19,273)
- 2020-P Proof Women’s Suffrage Centennial Silver Dollar (+1,069 to 24,851)
- 2020 America the Beautiful Quarters Proof Set (+968 to 62,624)
In its latest report, the U.S. Mint published sales data for 193 numismatic products. Ninety-seven of them outperformed their prior weekly gains compared to 85 previously. Not counting the newest products so as to compare apples to apples, 6 products increased by more than 1,000 units against 5 previously.
In addition, 9 products saw their sales reduced compared to 13 previously. The reductions ranged from 1 to 43, with the latter tagged to the 2020-W Uncirculated American Palladium Eagle.
US Mint Sales: Numismatic Products
Below are tables showing the latest available sales for U.S. Mint numismatic products. The sales period covers from Nov 2 to 8. Products with an asterisk (*) are no longer available or had no reported sales.
American Liberty Products |
||||
| Old Sales |
Latest Sales |
Gain/ Loss |
% Increase |
|
| 2019-W $100 American Liberty Gold Coin | 10,194 | 10,246 | 52 | 0.51% |
| 2019-P American Liberty Silver Medal | 44,785 | 44,775 | -10 | -0.02% |
| 2018-W $10 American Liberty Gold Coin | 35,640 | 35,715 | 75 | 0.21% |
| 2017 American Liberty Silver Four-Medal Set* | 32,647 | 32,647 | – | – |
| 2017-S Enhanced Uncirculated Coin Set* | 210,419 | 210,419 | – | – |
| 2017-W $100 American Liberty Gold Coin | 32,446 | 32,477 | 31 | 0.10% |
| 2017-P Proof American Liberty Silver Medal* | 55,187 | 55,187 | – | – |
2020 Basketball Hall of Fame Commemorative Coins |
||||
| Old Sales |
Latest Sales |
Gain/ Loss |
% Increase |
|
| 2020-W Proof $5 Basketball Gold Coin | 7,721 | 7,763 | 42 | 0.54% |
| 2020-W Uncirculated $5 Basketball Gold Coin | 3,118 | 3,132 | 14 | 0.45% |
| 2020-P Proof Basketball Silver Dollar | 65,262 | 65,570 | 308 | 0.47% |
| 2020-P Uncirculated Basketball Silver Dollar | 20,198 | 20,292 | 94 | 0.47% |
| 2020-S Proof Basketball Half Dollar | 25,758 | 25,829 | 71 | 0.28% |
| 2020-D Uncirculated Basketball Half Dollar | 13,228 | 13,269 | 41 | 0.31% |
| 2020 Basketball Kids Set | 21,736 | 21,834 | 98 | 0.45% |
| 2020-P Colorized Basketball Silver Dollar | 23,282 | 23,666 | 384 | 1.65% |
| 2020-S Colorized Basketball Half Dollar | 28,427 | 28,971 | 544 | 1.91% |
2020 Women’s Suffrage Centennial Products |
||||
| Old Sales |
Latest Sales |
Gain/ Loss |
% Increase |
|
| 2020-P Proof Silver Dollar | 23,782 | 24,851 | 1,069 | 4.49% |
| 2020-P Uncirculated Silver Dollar | 9,667 | 10,004 | 337 | 3.49% |
| 2020-P Proof Silver Dollar and Medal Set | 9,950 | 9,949 | -1 | -0.01% |
2019 American Legion Commemorative Coins |
||||
| Old Sales |
Latest Sales |
Gain/ Loss |
% Increase |
|
| 2019 American Legion Gold Coin and Emblem Print* | 277 | 277 | – | – |
| 2019 American Legion Silver Dollar and Emblem Print* | 1,788 | 1,788 | – | – |
| 2019 American Legion 50c and Emblem Print* | 1,026 | 1,026 | – | – |
| 2019 American Legion Silver Dollar and Medal Set* | 9,888 | 9,888 | – | – |
| 2019-W Proof $5 American Legion Gold Coin* | 3,190 | 3,190 | – | – |
| 2019-W Uncirculated $5 American Legion Gold Coin* | 2,927 | 2,927 | – | – |
| 2019-P Proof American Legion Silver Dollar* | 44,018 | 44,018 | – | – |
| 2019-P Uncirculated American Legion Silver Dollar* | 13,789 | 13,789 | – | – |
| 2019-S Proof American Legion Half Dollar* | 18,811 | 18,811 | – | – |
| 2019-D Uncirculated American Legion Half Dollar* | 11,430 | 11,430 | – | – |
| 2019 American Legion Three-Coin Proof Set* | 7,451 | 7,451 | – | – |
2019 Apollo 11 Commemorative Coins |
||||
| Old Sales |
Latest Sales |
Gain/ Loss |
% Increase |
|
| 2019-W Proof $5 Gold Coin & Intaglio Print* | 1,162 | 1,162 | – | – |
| 2019-P Proof Apollo 11 Silver Dollar & Intaglio Print* | 4,980 | 4,980 | – | – |
| 2019-W Proof $5 Apollo 11 Gold Coin* | 32,862 | 32,862 | – | – |
| 2019-W Uncirculated $5 Apollo 11 Gold Coin* | 12,035 | 12,035 | – | – |
| 2019-P Proof Apollo 11 Silver Dollar* | 218,995 | 218,995 | – | – |
| 2019-P Uncirculated Apollo 11 Silver Dollar* | 59,700 | 59,700 | – | – |
| 2019-S Proof Apollo 11 Half Dollar* | 66,822 | 66,822 | – | – |
| 2019-D Uncirculated Apollo 11 Half Dollar* | 41,742 | 41,742 | – | – |
| 2019-S Proof Apollo 11 Half Dollar Set* | 99,998 | 99,998 | – | – |
| 2019-P Proof Apollo 11 Five Ounce Silver Coin* | 68,301 | 68,301 | – | – |
Clad Proof Set |
||||
| Old Sales |
Latest Sales |
Gain/ Loss |
% Increase |
|
| 2020 Proof Set | 399,026 | 409,449 | 10,423 | 2.61% |
| 2019 Proof Set | 590,219 | 591,772 | 1,553 | 0.26% |
| 2018 Proof Set* | 517,081 | 517,081 | – | – |
| 2017 Proof Set* | 568,678 | 568,678 | – | – |
| 2020 American Innovation Dollars Proof Set | 54,937 | 58,645 | 3,708 | 6.75% |
| 2019 American Innovation Dollars Proof Set | 110,501 | 111,100 | 599 | 0.54% |
|
2020 America the Beautiful Quarters Proof Set |
61,656 | 62,624 | 968 | 1.57% |
| 2019 America the Beautiful Quarters Proof Set | 73,637 | 73,681 | 44 | 0.06% |
| 2018 America the Beautiful Quarters Proof Set* | 86,697 | 86,697 | – | – |
| 2020 Happy Birthday Gift Set | 16,165 | 16,315 | 150 | 0.93% |
| 2019 Happy Birthday Gift Set | 18,577 | 18,629 | 52 | 0.28% |
| 2018 Happy Birthday Gift Set* | 17,719 | 17,719 | – | – |
| 2020 Birth Gift Set | 21,864 | 22,374 | 510 | 2.33% |
| 2019 Birth Gift Set | 29,530 | 29,530 | – | – |
| 2018 Birth Gift Set | 33,014 | 33,046 | 32 | 0.10% |
Silver Proof Set |
||||
| Old Sales |
Latest Sales |
Gain/ Loss |
% Increase |
|
| 2020 Silver Proof Set | 293,284 | 296,503 | 3,219 | 1.10% |
| 2019 Silver Proof Set | 412,622 | 412,622 | – | – |
| 2018 Silver Proof Set* | 332,274 | 332,274 | – | – |
| 2018 Silver Reverse Proof Set* | 199,116 | 199,116 | – | – |
| 2020 America the Beautiful Quarters Silver Proof Set | 63,692 | 64,050 | 358 | 0.56% |
| 2019 America the Beautiful Quarters Silver Proof Set | 78,461 | 78,550 | 89 | 0.11% |
| 2018 America the Beautiful Quarters Silver Proof Set* | 79,301 | 79,301 | – | – |
| 2020 Congratulations Gift Set | 24,440 | 24,440 | – | – |
| 2019 Congratulations Gift Set | 30,754 | 30,880 | 126 | 0.41% |
| 2019 Limited Edition Silver Proof Set* | 47,404 | 47,404 | – | – |
| 2018 Limited Edition Silver Proof Set* | 49,479 | 49,479 | – | – |
US Mint Uncirculated Sets |
||||
| Old Sales |
Latest Sales |
Gain/ Loss |
% Increase |
|
| 2019 Native American $1 Coin and Currency Set | 46,966 | 46,966 | – | – |
| 2019 Uncirculated Mint Set | 341,020 | 341,560 | 540 | 0.16% |
| 2018 Uncirculated Mint Set* | 257,536 | 257,536 | – | – |
| 2017 Uncirculated Mint Set* | 286,813 | 286,813 | – | – |
Kids Coin Sets |
||||
| Old Sales |
Latest Sales |
Gain/ Loss |
% Increase |
|
| 2019 Youth Coin and Currency Set | 11,024 | 11,159 | 135 | 1.22% |
| 2019 Explore and Discover Coin Set | 34,102 | 34,214 | 112 | 0.33% |
| 2019 Rocketship* | 49,921 | 49,921 | – | – |
| 2014 Coin Discovery Set* | 13,151 | 13,151 | – | – |
Ornaments |
||||
| Old Sales |
Latest Sales |
Gain/ Loss |
% Increase |
|
| 2019 Mighty Minters Ornament | 4,641 | 4,695 | 54 | 1.16% |
| 2019 U.S. Mint Ornament | 8,078 | 8,168 | 90 | 1.11% |
Proof Silver Eagles |
||||
| Old Sales |
Latest Sales |
Gain/ Loss |
% Increase |
|
| 2020-W End of WWII Proof Silver Eagle | – | 74,242 | – | – |
| 2020-W Proof Silver Eagle | 357,202 | 357,202 | – | – |
| 2020-W Proof Silver Eagle (Bulk – 40 Coins) | 600 | 600 | – | – |
| 2020-S Proof Silver Eagle | 200,001 | 200,008 | 7 | 0.00% |
| 2020-S Proof Silver Eagle (Bulk – 40 Coins) | 440 | 440 | – | – |
| 2019-S Enhanced Reverse Proof Proof Silver Eagle* | 29,909 | 29,909 | – | – |
| 2019-S Proof Silver Eagle | 146,735 | 146,735 | – | – |
| 2019-S Proof Silver Eagle (Bulk – 40 Coins)* | 137 | 137 | – | – |
| 2019 Pride of Nations Two-Coin Set* | 99,675 | 99,675 | – | – |
| 2019-W Proof Silver Eagle* | 345,380 | 345,380 | – | – |
| 2019-W Proof Silver Eagle (Bulk – 40 Coins)* | 745 | 745 | – | – |
| 2018-S Proof Silver Eagle* | 158,785 | 158,785 | – | – |
| 2018-W Proof Silver Eagle* | 354,025 | 354,025 | – | – |
| 2018-W Proof Silver Eagle (Bulk Pack – 210 Coins)* | 182 | 182 | – | – |
Uncirculated Silver Eagles |
||||
| Old Sales |
Latest Sales |
Gain/ Loss |
% Increase |
|
| 2020 | 155,982 | 155,981 | -1 | 0.00% |
| 2020 Bulk 40* | 15 | 15 | – | – |
| 2019 | 138,139 | 138,139 | – | – |
| 2019 Bulk 40* | 66 | 66 | – | – |
| 2018* | 138,947 | 138,947 | – | – |
| 2017* | 176,739 | 176,739 | – | – |
2020 Proof American Eagle Gold Coins |
||||
| Old Sales |
Latest Sales |
Gain/ Loss |
% Increase |
|
| 1 oz End of WWII | – | 1,829 | – | – |
| 1 oz | 5,686 | 5,825 | 139 | 2.44% |
| 1/2 oz | 2,435 | 2,435 | – | – |
| 1/4 oz | 3,567 | 3,738 | 171 | 4.79% |
| 1/10 oz | 12,007 | 12,408 | 401 | 3.34% |
| 4-Coin Set | 8,146 | 8,195 | 49 | 0.60% |
2019 Proof American Eagle Gold Coins |
||||
| Old Sales |
Latest Sales |
Gain/ Loss |
% Increase |
|
| 1 oz | 5,867 | 5,867 | – | – |
| 1/2 oz* | 1,876 | 1,876 | – | – |
| 1/4 oz* | 3,035 | 3,035 | – | – |
| 1/10 oz* | 10,231 | 10,231 | – | – |
| 4-Coin Set | 7,587 | 7,592 | 5 | 0.07% |
Uncirculated American Eagle Gold Coins |
||||
| Old Sales |
Latest Sales |
Gain/ Loss |
% Increase |
|
| 2019* | 5,851 | 5,851 | – | – |
| 2018* | 8,518 | 8,518 | – | – |
| 2017* | 5,800 | 5,800 | – | – |
Proof American Buffalo Gold Coins |
||||
| Old Sales |
Latest Sales |
Gain/ Loss |
% Increase |
|
| 2020 Proof Gold Buffalo | 11,889 | 11,888 | -1 | -0.01% |
| 2019 Proof Gold Buffalo | 14,836 | 14,836 | – | – |
| 2018 Proof Gold Buffalo* | 15,756 | 15,756 | – | – |
| 2017 Proof Gold Buffalo* | 15,810 | 15,810 | – | – |
Proof American Platinum Eagle |
||||
| Old Sales |
Latest Sales |
Gain/ Loss |
% Increase |
|
| 2020 | 7,604 | 7,658 | 54 | 0.71% |
| 2019 | 10,841 | 10,856 | 15 | 0.14% |
| 2018 | 14,441 | 14,450 | 9 | 0.06% |
| 2017* | 8,890 | 8,890 | – | – |
American Palladium Eagle |
||||
| Old Sales |
Latest Sales |
Gain/ Loss |
% Increase |
|
| 2020-W Uncirculated | 9,941 | 9,898 | -43 | -0.43% |
| 2019-W Reverse Proof | 18,060 | 18,095 | 35 | 0.19% |
| 2018-W Proof* | 14,986 | 14,986 | – | – |
First Spouse Gold Coins |
||||
| Old Sales |
Latest Sales |
Gain/ Loss |
% Increase |
|
| 2020-W Proof Barbara Bush First Spouse Gold Coin | 1,985 | 2,020 | 35 | 1.76% |
| 2020-W Uncirculated Barbara Bush First Spouse Gold Coin | 1,307 | 1,333 | 26 | 1.99% |
America the Beautiful 5 Oz Silver Coins |
||||
| Old Sales |
Latest Sales |
Gain/ Loss |
% Increase |
|
| 2020-P Salt River Bay Silver Uncirculated Coin | 13,716 | 13,707 | -9 | -0.07% |
| 2020-P Weir Farm Silver Uncirculated Coin | 13,683 | 13,756 | 73 | 0.53% |
|
2020-P National Park of American Samoa Silver Uncirculated Coin |
15,777 | 15,777 | – | – |
| 2019-P River of No Return Silver Uncirculated Coin | 16,417 | 16,417 | – | – |
| 2019-P San Antonio Missions Silver Uncirculated Coin | 16,207 | 16,207 | – | – |
| 2019-P War In The Pacific Silver Uncirculated Coin | 16,275 | 16,275 | – | – |
| 2019-P American Memorial Park Silver Uncirculated Coin | 16,283 | 16,283 | – | – |
| 2019-P Lowell Five Ounce Silver Uncirculated Coin | 16,647 | 16,647 | – | – |
| 2018-P Block Island Silver Coins* | 15,913 | 15,913 | – | – |
| 2018-P Cumberland Island Silver Coins* | 16,377 | 16,377 | – | – |
| 2018-P Voyageurs Silver Coins* | 16,839 | 16,839 | – | – |
| 2018-P Apostle Islands Silver Coins* | 16,802 | 16,802 | – | – |
| 2018-P Pictured Rocks Silver Coins* | 17,773 | 17,773 | – | – |
| 2017-P George Rogers Clark Silver Coins* | 14,731 | 14,731 | – | – |
| 2017-P Ellis Island Silver Coins* | 17,670 | 17,670 | – | – |
| 2017-P Ozark Riverways Silver Coins | 17,694 | 17,694 | – | – |
| 2017-P Frederick Douglass Silver Coins* | 17,678 | 17,678 | – | – |
| 2017-P Effigy Mounds Silver Coins* | 17,251 | 17,251 | – | – |
Presidential Silver Medals |
||||
| Old Sales |
Latest Sales |
Gain/ Loss |
% Increase |
|
| 2020 Andrew Jackson Presidential Silver Medal | 12,199 | 12,254 | 55 | 0.45% |
| 2019 John Quincy Adams Presidential Silver Medal | 11,801 | 11,821 | 20 | 0.17% |
| 2019 James Monroe Presidential Silver Medal | 12,235 | 12,247 | 12 | 0.10% |
| 2019 James Madison Presidential Silver Medal | 13,089 | 13,100 | 11 | 0.08% |
| 2019 Thomas Jefferson Presidential Silver Medal | 17,170 | 17,205 | 35 | 0.20% |
| 2018 George Washington Presidential Silver Medal | 25,691 | 25,736 | 45 | 0.18% |
| 2018 John Adams Presidential Silver Medal | 19,456 | 19,489 | 33 | 0.17% |
2020 American Innovation Dollars – Massachusetts |
||||
| Old Sales |
Latest Sales |
Gain/ Loss |
% Increase |
|
| 25-coin roll set (P) | 5,259 | 5,259 | – | – |
| 25-coin roll set (D) | 4,738 | 4,820 | 82 | 1.73% |
| 100-coin bag (P) | 2,005 | 1,951 | -54 | -2.69% |
| 100-coin bag (D) | 2,316 | 2,048 | -268 | -11.57% |
2020 American Innovation Dollars – Connecticut |
||||
| Old Sales |
Latest Sales |
Gain/ Loss |
% Increase |
|
| Reverse Proof (S) | 35,115 | 35,518 | 403 | 1.15% |
| 25-coin roll set (P) | 4,905 | 5,000 | 95 | 1.94% |
| 25-coin roll set (D) | 4,713 | 4,794 | 81 | 1.72% |
| 100-coin bag (P) | 1,822 | 1,908 | 86 | 4.72% |
| 100-coin bag (D) | 2,177 | 2,266 | 89 | 4.09% |
2019 American Innovation Dollars – Georgia |
||||
| Old Sales |
Latest Sales |
Gain/ Loss |
% Increase |
|
| Reverse Proof (S) | 37,375 | 37,630 | 255 | 0.68% |
| 25-coin roll set (P) | 6,161 | 6,193 | 32 | 0.52% |
| 25-coin roll set (D) | 5,848 | 5,870 | 22 | 0.38% |
| 100-coin bag (P) | 2,369 | 2,378 | 9 | 0.38% |
| 100-coin bag (D) | 2,194 | 2,200 | 6 | 0.27% |
2019 American Innovation Dollars – New Jersey |
||||
| Old Sales |
Latest Sales |
Gain/ Loss |
% Increase |
|
| Reverse Proof (S) | 40,917 | 41,123 | 206 | 0.50% |
| 25-coin roll set (P) | 6,624 | 6,648 | 24 | 0.36% |
| 25-coin roll set (D) | 6,108 | 6,129 | 21 | 0.34% |
| 100-coin bag (P) | 2,617 | 2,627 | 10 | 0.38% |
| 100-coin bag (D) | 2,395 | 2,407 | 12 | 0.50% |
2019 American Innovation Dollars – Pennsylvania |
||||
| Old Sales |
Latest Sales |
Gain/ Loss |
% Increase |
|
| Reverse Proof (S) | 45,771 | 45,893 | 122 | 0.27% |
| 25-coin roll set (P) | 7,388 | 7,424 | 36 | 0.49% |
| 25-coin roll set (D) | 6,478 | 6,497 | 19 | 0.29% |
| 100-coin bag (P) | 2,297 | 2,303 | 6 | 0.26% |
| 100-coin bag (D) | 2,219 | 2,222 | 3 | 0.14% |
2019 American Innovation Dollars – Delaware |
||||
| Old Sales |
Latest Sales |
Gain/ Loss |
% Increase |
|
| Reverse Proof (S) | 61,569 | 61,706 | 137 | 0.22% |
| 25-coin roll set (P) | 7,162 | 7,183 | 21 | 0.29% |
| 25-coin roll set (D) | 6,726 | 6,746 | 20 | 0.30% |
| 100-coin bag (P) | 2,250 | 2,264 | 14 | 0.62% |
| 100-coin bag (D) | 2,467 | 2,486 | 19 | 0.77% |
2018 American Innovation Dollars |
||||
| Old Sales |
Latest Sales |
Gain/ Loss |
% Increase |
|
| Reverse Proof (S)* | 74,720 | 74,720 | – | – |
| Proof Coin (S) | 221,353 | 222,186 | 833 | 0.38% |
| 25-coin roll set (P) | 18,101 | 18,149 | 48 | 0.27% |
| 25-coin roll set (D) | 17,015 | 17,052 | 37 | 0.22% |
| 100-coin bag (P)* | 2,935 | 2,935 | – | – |
| 100-coin bag (D)* | 2,954 | 2,954 | – | – |
Native American Dollar Rolls |
||||
| Old Sales |
Latest Sales |
Gain/ Loss |
% Increase |
|
| 2020-dated 25-coin roll set (P) | 13,042 | 13,182 | 140 | 1.07% |
| 2020-dated 25-coin roll set (D) | 12,610 | 12,755 | 145 | 1.15% |
| 2020-dated 100-coin bag (P) | 1,963 | 1,962 | -1 | -0.05% |
| 2020-dated 100-coin bag (D) | 1,981 | 1,981 | – | – |
| 2020-dated 250-coin box (P) | 1,243 | 1,259 | 16 | 1.29% |
| 2020-dated 250-coin box (D) | 1,403 | 1,421 | 18 | 1.28% |
| 2019-dated 25-coin roll set (P) | 16,927 | 17,014 | 87 | 0.51% |
| 2019-dated 25-coin roll set (D) | 16,173 | 16,262 | 89 | 0.55% |
| 2019-dated 100-coin bag (P) | 1,829 | 1,829 | – | – |
| 2019-dated 100-coin bag (D) | 1,766 | 1,766 | – | – |
| 2019-dated 250-coin box (P)* | 1,734 | 1,734 | – | – |
| 2019-dated 250-coin box (D) | 1,949 | 1,949 | – | – |
| 2018-dated 25-coin roll set (P)* | 17,392 | 17,392 | – | – |
| 2018-dated 25-coin roll set (D)* | 16,555 | 16,555 | – | – |
| 2018-dated 100-coin bag (P)* | 1,931 | 1,931 | – | – |
| 2018-dated 100-coin bag (D)* | 1,930 | 1,930 | – | – |
| 2018-dated 250-coin box (P)* | 1,865 | 1,865 | – | – |
| 2018-dated 250-coin box (D)* | 1,874 | 1,874 | – | – |
Kennedy Half Dollar Rolls |
||||
| Old Sales |
Latest Sales |
Gain/ Loss |
% Increase |
|
| 2020-dated 200-coin bag (P&D) | 6,174 | 6,240 | 66 | 1.07% |
| 2020-dated 2-roll set (P&D) | 23,759 | 24,068 | 309 | 1.30% |
| 2019-dated 200-coin bag (P&D) | 10,641 | 10,735 | 94 | 0.88% |
| 2019-dated 2-roll set (P&D) | 23,850 | 23,933 | 83 | 0.35% |
| 2018-dated 200-coin bag (P&D)* | 9,498 | 9,498 | – | – |
| 2018-dated 2-roll set (P&D)* | 22,622 | 22,622 | – | – |
America the Beautiful Quarters Uncirculated Coin Set |
||||
| Old Sales |
Latest Sales |
Gain/ Loss |
% Increase |
|
| 2020 Issue | 24,796 | 24,796 | – | – |
| 2019 Issue | 29,438 | 29,542 | 104 | 0.35% |
| 2018 Issue* | 32,648 | 32,648 | – | – |
| 2017 Issue* | 29,972 | 29,972 | – | – |
America the Beautiful Quarters Circulating Coin Set |
||||
| Old Sales |
Latest Sales |
Gain/ Loss |
% Increase |
|
| 2020 Issue | 18,156 | 19,273 | 1,117 | 6.15% |
| 2019 Issue | 22,484 | 22,587 | 103 | 0.46% |
| 2018 Issue | 22,641 | 22,641 | – | – |
| 2017 Issue* | 24,765 | 24,765 | – | – |
| 2016 Issue* | 23,958 | 23,958 | – | – |
America the Beautiful Quarters Three-Coin Sets |
||||
| Old Sales |
Latest Sales |
Gain/ Loss |
% Increase |
|
| Tallgrass Prairie | – | 11,181 | – | – |
| Marsh-Billings-Rockefeller | 10,614 | 11,153 | 539 | 5.08% |
| Salt River Bay | 12,110 | 12,199 | 89 | 0.73% |
| Weir Farm | 12,257 | 12,349 | 92 | 0.75% |
| National Park of American Samoa | 15,385 | 15,385 | – | – |
| River of No Return | 13,275 | 13,301 | 26 | 0.20% |
| San Antonio Missions | 15,232 | 15,237 | 5 | 0.03% |
| War in Pacific | 15,419 | 15,419 | – | – |
| American Memorial Park | 14,744 | 14,772 | 28 | 0.19% |
| Lowell | 14,885 | 14,910 | 25 | 0.17% |
| Block Island | 13,947 | 13,965 | 18 | 0.13% |
| Cumberland Island | 14,017 | 14,033 | 16 | 0.11% |
| Voyageurs | 14,931 | 14,940 | 9 | 0.06% |
| Apostle Islands | 14,967 | 14,976 | 9 | 0.06% |
| Pictured Rocks* | 15,397 | 15,397 | – | – |
| George Rogers Clark* | 14,133 | 14,133 | – | – |
| Ellis Island* | 16,947 | 16,947 | – | – |
| Ozark Riverways* | 14,912 | 14,912 | – | – |
| Frederick Douglass* | 15,566 | 15,566 | – | – |
| Effigy Mounds* | 14,516 | 14,516 | – | – |
| Fort Moultrie* | 13,306 | 13,306 | – | – |
| Theodore Roosevelt* | 16,072 | 16,072 | – | – |
| Harpers Ferry* | 14,345 | 14,345 | – | – |
| Cumberland Gap* | 14,973 | 14,973 | – | – |
| Shawnee* | 15,474 | 15,474 | – | – |
| Saratoga* | 14,950 | 14,950 | – | – |
| Bombay Hook* | 13,400 | 13,400 | – | – |
| Blue Ridge Parkway* | 17,165 | 17,165 | – | – |
| Kisatchie Set* | 15,196 | 15,196 | – | – |
| Homestead Set* | 16,114 | 16,114 | – | – |
| Everglades Set* | 14,373 | 14,373 | – | – |
| Great Sand Dunes Set* | 14,119 | 14,119 | – | – |
| Arches Three-Coin Set* | 15,859 | 15,859 | – | – |
| Shenandoah Three-Coin Set* | 17,351 | 17,351 | – | – |
| Great Smoky Mountains Set* | 18,588 | 18,588 | – | – |
| Mount Rushmore Quarters Set* | 17,924 | 17,924 | – | – |
| Fort McHenry Quarters Set* | 16,345 | 16,345 | – | – |
| Great Basin Quarters Set* | 15,526 | 15,526 | – | – |
| Perry’s Victory Quarters Set* | 17,643 | 17,643 | – | – |
| White Mountain Quarters Set* | 18,056 | 18,056 | – | – |
| Denali Quarters Set* | 18,193 | 18,193 | – | – |
| Hawaii Volcanoes Quarters Set* | 19,947 | 19,947 | – | – |
| Acadia Quarters Set* | 19,940 | 19,940 | – | – |
| Chaco Culture Quarters Set* | 20,028 | 20,028 | – | – |
| El Yunque Quarters Set* | 19,891 | 19,891 | – | – |
| Chickasaw Quarters Set* | 16,184 | 16,184 | – | – |
| Vicksburg Quarters Set* | 18,095 | 18,095 | – | – |
| Olympic Quarters Set* | 17,718 | 17,718 | – | – |
| Glacier Quarters Set* | 19,046 | 19,046 | – | – |
| Gettysburg Quarters Set* | 22,869 | 22,869 | – | – |
| Mount Hood Quarters Set* | 18,384 | 18,384 | – | – |
| Grand Canyon Quarters Set* | 22,133 | 22,133 | – | – |
| Yosemite Quarters Set* | 22,154 | 22,154 | – | – |
| Yellowstone Quarters Set* | 25,048 | 25,048 | – | – |
| Hot Springs Quarters Set* | 23,203 | 23,203 | – | – |
2020 Marsh-Billings-Rockefeller Quarters |
||||
| Old Sales |
Latest Sales |
Gain/ Loss |
% Increase |
|
| 100-Coin Bag (S) | 3,347 | 3,416 | 69 | 2.06% |
| 40-Coin Roll (S) | 2,802 | 2,857 | 55 | 1.96% |
| Three-Roll Set | 7,121 | 7,243 | 122 | 1.71% |
| 100-Coin Bag (P) | 1,942 | 1,990 | 48 | 2.47% |
| 100-Coin Bag (D) | 1,894 | 1,942 | 48 | 2.53% |
| Two-Roll Set | 4,915 | 4,958 | 43 | 0.87% |
2020 Salt River Bay Quarters |
||||
| Old Sales |
Latest Sales |
Gain/ Loss |
% Increase |
|
| 100-Coin Bag (S) | 3,742 | 3,789 | 47 | 1.26% |
| 40-Coin Roll (S) | 3,623 | 3,645 | 22 | 0.61% |
| Three-Roll Set | 7,835 | 7,877 | 42 | 0.54% |
| 100-Coin Bag (P) | 2,248 | 2,280 | 32 | 1.42% |
| 100-Coin Bag (D) | 2,197 | 2,216 | 19 | 0.86% |
| Two-Roll Set | 5,226 | 5,241 | 15 | 0.29% |
2020 Weir Farm Quarters |
||||
| Old Sales |
Latest Sales |
Gain/ Loss |
% Increase |
|
| 100-Coin Bag (S) | 3,785 | 3,825 | 40 | 1.06% |
| 40-Coin Roll (S) | 3,974 | 3,974 | – | – |
| Three-Roll Set | 8,131 | 8,169 | 38 | 0.47% |
| 100-Coin Bag (P) | 2,446 | 2,446 | – | – |
| 100-Coin Bag (D) | 2,446 | 2,446 | – | – |
| Two-Roll Set | 5,460 | 5,469 | 9 | 0.16% |
2020 National Park of American Samoa Quarters |
||||
| Old Sales |
Latest Sales |
Gain/ Loss |
% Increase |
|
| 100-Coin Bag (S) | 4,236 | 4,236 | – | – |
| 40-Coin Roll (S) | 3,974 | 3,974 | – | – |
| Three-Roll Set | 8,930 | 8,930 | – | – |
| 100-Coin Bag (P) | 2,456 | 2,456 | – | – |
| 100-Coin Bag (D) | 2,480 | 2,480 | – | – |
| Two-Roll Set | 6,927 | 6,927 | – | – |
2019 River of No Return Quarters |
||||
| Old Sales |
Latest Sales |
Gain/ Loss |
% Increase |
|
| 100-Coin Bag (S) | 4,033 | 4,041 | 8 | 0.20% |
| 40-Coin Roll (S) | 3,961 | 3,961 | – | – |
| Three-Roll Set | 8,436 | 8,457 | 21 | 0.25% |
| 100-Coin Bag (P) | 2,289 | 2,290 | 1 | 0.04% |
| 100-Coin Bag (D) | 2,178 | 2,180 | 2 | 0.09% |
| Two-Roll Set | 5,760 | 5,760 | – | – |
2019 San Antonio Missions Quarters |
||||
| Old Sales |
Latest Sales |
Gain/ Loss |
% Increase |
|
| 100-Coin Bag (S) | 4,201 | 4,201 | – | – |
| 40-Coin Roll (S) | 3,929 | 3,929 | – | – |
| Three-Roll Set | 8,858 | 8,858 | – | – |
| 100-Coin Bag (P) | 2,441 | 2,441 | – | – |
| 100-Coin Bag (D) | 2,367 | 2,367 | – | – |
| Two-Roll Set | 6,041 | 6,041 | – | – |
2019 War In The Pacific Quarters |
||||
| Old Sales |
Latest Sales |
Gain/ Loss |
% Increase |
|
| 100-Coin Bag (S) | 4,203 | 4,203 | – | – |
| 40-Coin Roll (S) | 3,838 | 3,838 | – | – |
| Three-Roll Set | 8,764 | 8,764 | – | – |
| 100-Coin Bag (P) | 2,391 | 2,391 | – | – |
| 100-Coin Bag (D) | 2,291 | 2,291 | – | – |
| Two-Roll Set | 6,049 | 6,049 | – | – |
2019 American Memorial Park Quarters |
||||
| Old Sales |
Latest Sales |
Gain/ Loss |
% Increase |
|
| 100-Coin Bag (S) | 4,114 | 4,114 | – | – |
| 40-Coin Roll (S) | 3,859 | 3,859 | – | – |
| Three-Roll Set | 8,478 | 8,478 | – | – |
| 100-Coin Bag (P)* | 2,455 | 2,455 | – | – |
| 100-Coin Bag (D)* | 2,421 | 2,421 | – | – |
| Two-Roll Set | 6,059 | 6,059 | – | – |
2019 Lowell Quarters |
||||
| Old Sales |
Latest Sales |
Gain/ Loss |
% Increase |
|
| 100-Coin Bag (S)* | 4,006 | 4,006 | – | – |
| 40-Coin Roll (S)* | 3,801 | 3,801 | – | – |
| Three-Roll Set* | 8,596 | 8,596 | – | – |
| 100-Coin Bag (P)* | 2,435 | 2,435 | – | – |
| 100-Coin Bag (D)* | 2,325 | 2,325 | – | – |
| Two-Roll Set* | 6,168 | 6,168 | – | – |


