Last week, the United States Mint started selling their 5-coin set of silver 2024 quarters honoring Rev. Dr. Pauli Murray, Honorable Patsy Takemoto Mink, Dr. Mary Edwards Walker, Celia Cruz, and Zitkala-Ša.
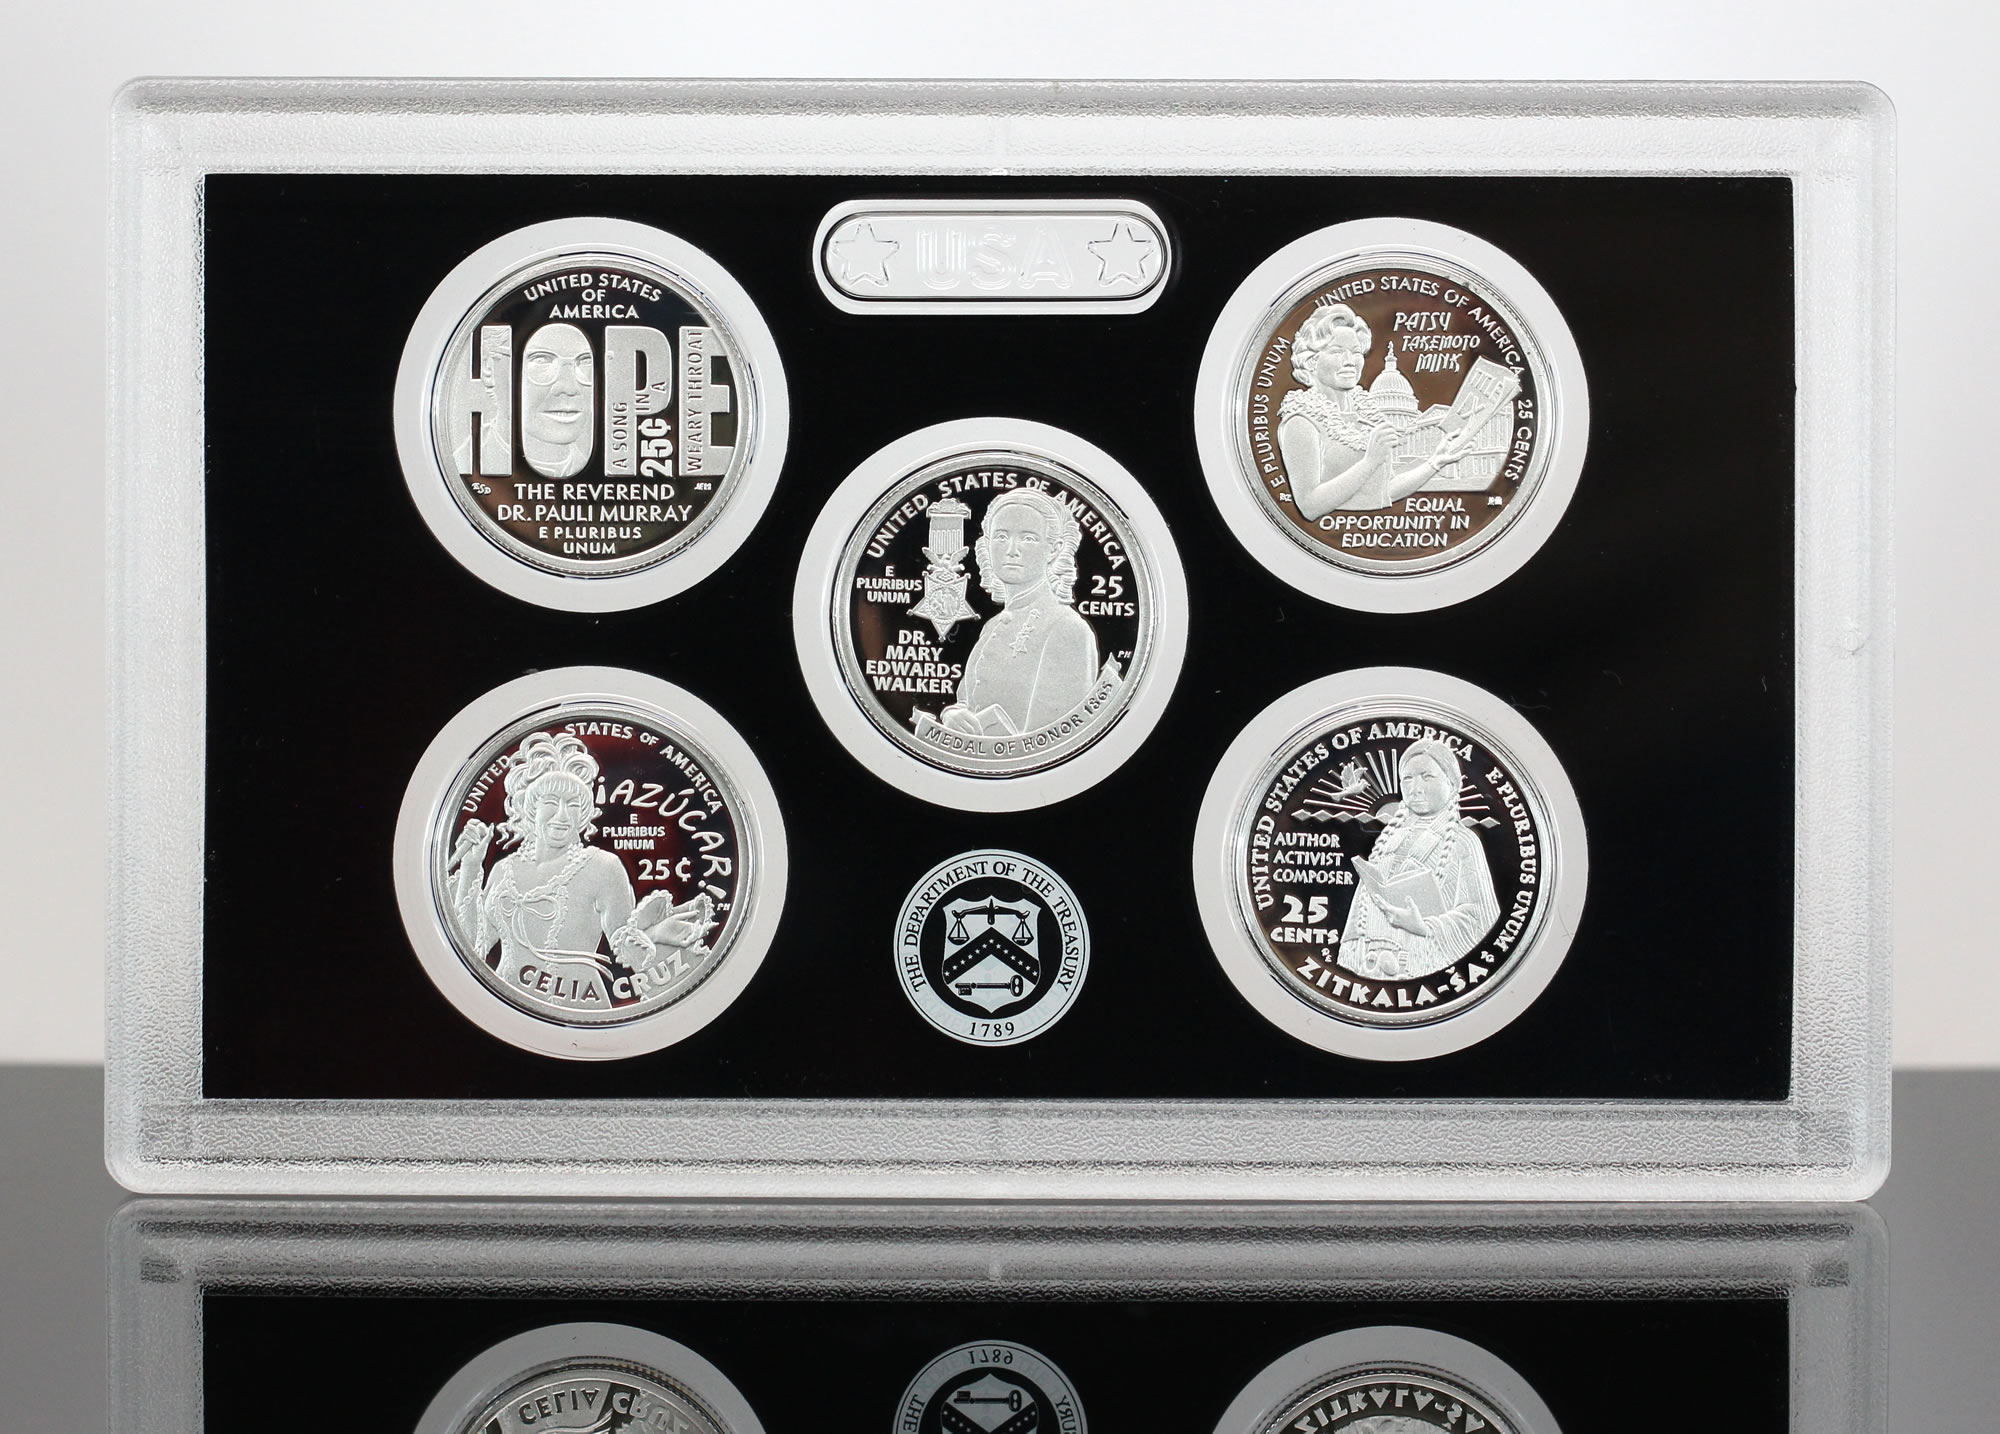
It was released on April 2 for $80, and it posted 6-day opening sales of 33,792 units, making it the U.S. Mint’s best weekly seller.
For comparison, the set from last year remains available at the same $80 price, and debuted with 5-day sales of 38,782 units. Most recently, it saw a weekly gain of 101 units, bringing the total to 44,954.
Looking back further, the 2022 set opened with sales of 57,735 units, was not available for long, and eventually settled with sales of 57,699 units. This set had advantages such as a lower price of $73 and marked the introduction of silver quarters honoring women, coinciding with the launch of the Mint’s series of American Women quarter dollars.
Elsewhere, Mint data shows many of its silver products enjoyed some extra attention and stronger sales, supported by recent surging prices for silver.
U.S. Mint Top Seller’s
Here is the roster of the U.S. Mint’s most sought-after numismatic products for the week ending on April 7:
- 2024 American Women Quarters Silver Proof Set (+33,792)
- 2024-W Proof Silver Eagle (+961 to 236,732)
- 2023-S Proof Morgan Silver Dollar (+596 to 347,829)
- 2024 American Women Quarters Proof Set (+583 to 34,826)
- 2024-P Proof Greatest Generation Silver Dollar (+564 to 21,849)
- 2024-P Proof Harriet Tubman Silver Dollar (+443 to 16,556)
- 2023-S Proof Peace Silver Dollar (+419 to 316,853)
- 2023 Mint Set (+370 to 176,052)
- 2024-P, D & S Patsy Takemoto Mink Quarters Three-Roll Sets (+320 to 11,497)
- 2021 Mint Set (+278 to 229,595)
In its latest report, the U.S. Mint published sales data for 442 numismatic products. The data revealed that 65 products outperformed their sales from the previous week, compared to 67 in the prior report. No products experienced a week-over-week increase of more than 1,000 units, compared to 5 in the previous report.
In addition, there were 5 products that recorded negative weekly sales, compared to 8 in the previous report. These reductions ranged from 2 to 820, with the latter attributed to the 2024 Proof Set.
US Mint Sales: Numismatic Products
Below are tables showing the latest available sales for U.S. Mint numismatic products. The sales period covers from April 1 to April 7. Products with an asterisk (*) are no longer available or had no reported sales.
2024 Commemorative Coins |
||||
| Old Sales |
Latest Sales |
Gain/ Loss |
% Increase |
|
| 2024-S Proof Greatest Generation Half Dollar | 13,762 | 13,982 | 220 | 1.60% |
| 2024-D Uncirculated Greatest Generation Half Dollar | 6,231 | 6,330 | 99 | 1.59% |
| 2024-P Proof Greatest Generation Silver Dollar | 21,285 | 21,849 | 564 | 2.65% |
| 2024-P Uncirculated Greatest Generation Silver Dollar | 7,928 | 8,121 | 193 | 2.43% |
| 2024-W Proof Greatest Generation $5 Gold Coin | 1,136 | 1,171 | 35 | 3.08% |
| 2024-W Uncirculated Greatest Generation $5 Gold Coin | 952 | 971 | 19 | 2.00% |
| 2024 Greatest Generation Three-Coin Proof Set | 3,502 | 3,577 | 75 | 2.14% |
| 2024-S Proof Harriet Tubman Half Dollar | 9,899 | 10,063 | 164 | 1.66% |
| 2024-D Uncirculated Harriet Tubman Half Dollar | 5,376 | 5,406 | 30 | 0.56% |
| 2024-P Proof Harriet Tubman Silver Dollar | 16,113 | 16,556 | 443 | 2.75% |
| 2024-P Uncirculated Harriet Tubman Silver Dollar | 6,008 | 6,049 | 41 | 0.68% |
| 2024-W Proof Harriet Tubman $5 Gold Coin | 1,334 | 1,340 | 6 | 0.45% |
| 2024-W Uncirculated Harriet Tubman $5 Gold Coin | 1,022 | 1,039 | 17 | 1.66% |
| 2024 Harriet Tubman Three-Coin Proof Set | 3,744 | 3,741 | -3 | -0.08% |
Morgan & Peace Silver Dollars |
||||
| Old Sales |
Latest Sales |
Gain/ Loss |
% Increase |
|
| 2023-S Morgan & Peace Silver Dollar Reverse Proof Set | 247,753 | 247,753 | – | – |
| 2023-S Proof Morgan Silver Dollar | 347,233 | 347,829 | 596 | 0.17% |
| 2023-S Proof Morgan Silver Dollar (Bulk – 40 Coins) | 443 | 443 | – | – |
| 2023-S Proof Peace Silver Dollar | 316,434 | 316,853 | 419 | 0.13% |
| 2023-S Proof Peace Silver Dollar (Bulk – 40 Coins) | 438 | 438 | – | – |
| 2023-P Uncirculated Morgan Silver Dollar | 260,476 | 260,476 | – | – |
| 2023-P Uncirculated Morgan Silver Dollar (40 – Bulk) | 330 | 330 | – | – |
| 2023-P Uncirculated Peace Silver Dollar | 258,898 | 258,898 | – | – |
| 2023-P Uncirculated Peace Silver Dollar (40 – Bulk) | 338 | 338 | – | – |
2024 Liberty & Britannia |
||||
| Old Sales |
Latest Sales |
Gain/ Loss |
% Increase |
|
| 2024-W Liberty & Britannia Gold Coin | 5,498 | 5,496 | -2 | -0.04% |
| 2024-P Liberty & Britannia Silver Medal | 32,818 | 32,804 | -14 | -0.04% |
Armed Forces Silver Medals |
||||
| Old Sales |
Latest Sales |
Gain/ Loss |
% Increase |
|
| U.S. Army 2.5 Ounce Silver Medal | 9,988 | 9,988 | – | – |
| U.S. Marine Corps 2.5 Ounce Silver Medal | 9,575 | 9,575 | – | – |
| U.S. Navy 2.5 Ounce Silver Medal | 9,987 | 9,987 | – | – |
| U.S. Coast Guard 2.5 Ounce Silver Medal | 9,955 | 9,955 | – | – |
| U.S. Air Force 2.5 Ounce Silver Medal | 9,953 | 9,953 | – | – |
| U.S. Marine Corps 1 Ounce Silver Medal | 18,527 | 18,596 | 69 | 0.37% |
| U.S. Navy 1 Ounce Silver Medal | 20,100 | 20,164 | 64 | 0.32% |
| U.S. Coast Guard 1 Ounce Silver Medal | 17,659 | 17,671 | 12 | 0.07% |
| U.S. Air Force 1 Ounce Silver Medal | 20,144 | 20,185 | 41 | 0.20% |
American Liberty Products |
||||
| Old Sales |
Latest Sales |
Gain/ Loss |
% Increase |
|
| 2023-W $100 American Liberty Gold Coin | 12,173 | 12,177 | 4 | 0.03% |
| 2023-P American Liberty Silver Medal | 31,368 | 31,441 | 73 | 0.23% |
| 2022-P American Liberty Silver Medal | 74,342 | 74,343 | 1 | 0.00% |
| 2021-W $100 American Liberty Gold Coin | 12,471 | 12,471 | – | – |
| 2019-W $100 American Liberty Gold Coin | 24,609 | 24,609 | – | – |
| 2019-P American Liberty Silver Medal | 44,928 | 44,928 | – | – |
| 2018-W $10 American Liberty Gold Coin | 59,452 | 59,592 | 140 | 0.24% |
| 2017 American Liberty Silver Four-Medal Set* | 32,647 | 32,647 | – | – |
| 2017-S Enhanced Uncirculated Coin Set* | 210,419 | 210,419 | – | – |
| 2017-W $100 American Liberty Gold Coin | 39,214 | 39,229 | 15 | 0.04% |
| 2017-P Proof American Liberty Silver Medal* | 55,187 | 55,187 | – | – |
Clad Proof Sets |
||||
| Old Sales |
Latest Sales |
Gain/ Loss |
% Increase |
|
| 2024 Proof Set | 209,229 | 208,409 | -820 | -0.39% |
| 2023 Proof Set* | 369,230 | 369,228 | -2 | 0.00% |
| 2022 Proof Set* | 400,016 | 400,016 | – | – |
| 2021 Proof Set* | 512,848 | 512,848 | – | – |
| 2020 Proof Set* | 464,658 | 464,658 | – | – |
| 2019 Proof Set* | 601,364 | 601,364 | – | – |
| 2018 Proof Set* | 517,081 | 517,081 | – | – |
| 2017 Proof Set* | 568,678 | 568,678 | – | – |
| 2023 American Innovation Dollars Proof Set | 53,694 | 53,793 | 99 | 0.18% |
| 2022 American Innovation Dollars Proof Set | 79,306 | 79,442 | 136 | 0.17% |
| 2021 American Innovation Dollars Proof Set | 85,597 | 85,664 | 67 | 0.08% |
| 2020 American Innovation Dollars Proof Set | 107,066 | 107,066 | – | – |
| 2019 American Innovation Dollars Proof Set | 148,557 | 148,557 | – | – |
| 2024 American Women Quarters Proof Set | 34,243 | 34,826 | 583 | 1.70% |
| 2023 American Women Quarters Proof Set | 55,902 | 56,010 | 108 | 0.19% |
| 2022 American Women Quarters Proof Set* | 42,821 | 42,821 | – | – |
| 2020 America the Beautiful Quarters Proof Set* | 64,242 | 64,242 | – | – |
| 2019 America the Beautiful Quarters Proof Set | 84,697 | 84,697 | – | – |
| 2018 America the Beautiful Quarters Proof Set* | 86,697 | 86,697 | – | – |
Silver Proof Sets |
||||
| Old Sales |
Latest Sales |
Gain/ Loss |
% Increase |
|
| 2023 Silver Proof Set | 191,044 | 191,258 | 214 | 0.11% |
| 2022 Silver Proof Set | 248,021 | 248,083 | 62 | 0.02% |
| 2021 Silver Proof Set | 302,523 | 302,562 | 39 | 0.01% |
| 2020 Silver Proof Set* | 313,183 | 313,183 | – | – |
| 2019 Silver Proof Set* | 412,708 | 412,708 | – | – |
| 2018 Silver Proof Set* | 332,273 | 332,273 | – | – |
| 2018 Silver Reverse Proof Set* | 199,116 | 199,116 | – | – |
| 2024 American Women Quarters Silver Proof Set | – | 33,792 | – | – |
| 2023 American Women Quarters Silver Proof Set | 44,853 | 44,954 | 101 | 0.23% |
| 2022 American Women Quarters Silver Proof Set | 57,696 | 57,699 | 3 | 0.01% |
| 2020 America the Beautiful Quarters Silver Proof Set* | 64,012 | 64,012 | – | – |
| 2019 America the Beautiful Quarters Silver Proof Set* | 78,588 | 78,588 | – | – |
| 2018 America the Beautiful Quarters Silver Proof Set* | 79,301 | 79,301 | – | – |
| 2024 Congratulations Gift Set | 17,869 | 18,129 | 260 | 1.46% |
| 2023 Congratulations Gift Set | 39,268 | 39,268 | – | – |
| 2022 Congratulations Gift Set | 29,710 | 29,710 | – | – |
| 2021 Congratulations Gift Set* | 39,997 | 39,997 | – | – |
| 2020 Congratulations Gift Set* | 24,468 | 24,468 | – | – |
| 2019 Congratulations Gift Set* | 31,638 | 31,638 | – | – |
| 2023 Limited Edition Silver Proof Set | 24,833 | 24,930 | 97 | 0.39% |
| 2022 Limited Edition Silver Proof Set | 49,711 | 49,711 | – | – |
| 2021 Limited Edition Silver Proof Set | 48,712 | 48,712 | – | – |
| 2020 Limited Edition Silver Proof Set* | 50,061 | 50,061 | – | – |
US Mint Uncirculated Sets |
||||
| Old Sales |
Latest Sales |
Gain/ Loss |
% Increase |
|
| 2023 Uncirculated Mint Set | 175,682 | 176,052 | 370 | 0.21% |
| 2022 Uncirculated Mint Set | 249,973 | 249,976 | 3 | 0.00% |
| 2021 Uncirculated Mint Set | 229,317 | 229,595 | 278 | 0.12% |
| 2020 Uncirculated Mint Set* | 211,787 | 211,787 | – | – |
| 2019 Uncirculated Mint Set* | 346,117 | 346,117 | – | – |
| 2018 Uncirculated Mint Set* | 257,536 | 257,536 | – | – |
| 2017 Uncirculated Mint Set* | 286,813 | 286,813 | – | – |
Kids Coin Sets |
||||
| Old Sales |
Latest Sales |
Gain/ Loss |
% Increase |
|
| 2019 Youth Coin and Currency Set | 24,888 | 24,888 | – | – |
| 2019 Explore and Discover Coin Set | 43,994 | 44,021 | 27 | 0.06% |
| 2019 Rocketship* | 49,921 | 49,921 | – | – |
| 2014 Coin Discovery Set* | 13,151 | 13,151 | – | – |
Ornaments |
||||
| Old Sales |
Latest Sales |
Gain/ Loss |
% Increase |
|
| 2023 U.S. Mint Ornament | 4,988 | 4,990 | 2 | 0.04% |
| 2023 Mighty Minters Ornament | 3,047 | 3,047 | – | – |
| 2022 U.S. Mint Ornament | 5,749 | 5,750 | 1 | 0.02% |
| 2022 Mighty Minters Ornament | 4,102 | 4,103 | 1 | 0.02% |
| 2023 Bessie Coleman Ornament | 1,220 | 1,223 | 3 | 0.25% |
| 2023 Edith Kanakaʻole Ornament; | 1,390 | 1,391 | 1 | 0.07% |
| 2023 Eleanor Roosevelt Ornament | 1,665 | 1,668 | 3 | 0.18% |
| 2023 Jovita Idar Ornament | 1,226 | 1,227 | 1 | 0.08% |
| 2023 Maria Tallchief Ornament | 1,457 | 1,460 | 3 | 0.21% |
| 2022 Maya Angelou Ornament | 3,245 | 3,255 | 10 | 0.31% |
| 2022 Dr. Sally Ride Ornament | 3,340 | 3,345 | 5 | 0.15% |
| 2022 Wilma Mankiller Ornament | 2,320 | 2,325 | 5 | 0.22% |
| 2022 Nina Otero-Warren Ornament | 1,820 | 1,823 | 3 | 0.16% |
| 2022 Anna May Wong Ornament | 3,230 | 3,234 | 4 | 0.12% |
| 2021 Mighty Minters Ornament | 4,821 | 4,821 | – | – |
| 2021 U.S. Mint Ornament | 7,969 | 7,969 | – | – |
| 2020 Mighty Minters Ornament | 4,572 | 4,572 | – | – |
| 2020 U.S. Mint Ornament | 6,695 | 6,696 | 1 | 0.01% |
| 2019 Mighty Minters Ornament | 7,104 | 7,104 | – | – |
| 2019 U.S. Mint Ornament | 11,948 | 11,950 | 2 | 0.02% |
Proof & Reverse Proof Silver Eagles |
||||
| Old Sales |
Latest Sales |
Gain/ Loss |
% Increase |
|
| 2024-W Proof Silver Eagle | 235,771 | 236,732 | 961 | 0.41% |
| 2024-W Proof Silver Eagle (Bulk – 40 Coins) | 1,392 | 1,392 | – | – |
| 2023-S Proof Silver Eagle | 178,723 | 178,825 | 102 | 0.06% |
| 2023-S Proof Silver Eagle (Bulk – 40 Coins) | 743 | 743 | – | – |
| 2022-S Proof Silver Eagle | 199,698 | 199,698 | – | – |
| 2022-S Proof Silver Eagle (Bulk – 40 Coins) | 2,925 | 2,925 | – | – |
| 2023-W Proof Silver Eagle | 436,420 | 436,420 | – | – |
| 2023-W Proof Silver Eagle (Bulk – 40 Coins) | 2,118 | 2,118 | – | – |
| 2022-W Proof Silver Eagle | 496,993 | 496,993 | – | – |
| 2022-W Proof Silver Eagle (Bulk – 40 Coins) | 4,106 | 4,106 | – | – |
| 2021 Reverse Proof American Silver Eagle Two-Coin Set* | 124,917 | 124,917 | – | – |
| 2021-S Proof Silver Eagle, Type 2* | 199,744 | 199,744 | – | – |
| 2021-S Proof Silver Eagle, Type 2 (Bulk – 40 Coins)* | 652 | 652 | – | – |
| 2021-W Proof Silver Eagle, Type 2* | 300,096 | 300,096 | – | – |
| 2021-W Proof Silver Eagle, Type 2 (Bulk – 40 Coins)* | 2,142 | 2,142 | – | – |
| 2021-W Proof Silver Eagle, Type 1* | 299,898 | 299,898 | – | – |
| 2021-W Proof Silver Eagle, Type 1 (Bulk – 40 Coins)* | 686 | 686 | – | – |
Uncirculated Silver Eagles |
||||
| Old Sales |
Latest Sales |
Gain/ Loss |
% Increase |
|
| 2023 | 137,446 | 137,559 | 113 | 0.08% |
| 2022 | 160,222 | 160,275 | 53 | 0.03% |
| 2022 Bulk 40 | 987 | 987 | – | – |
| 2021* | 174,933 | 174,933 | – | – |
| 2021 Bulk 40* | 324 | 324 | – | – |
2023 Proof American Eagle Gold Coins |
||||
| Old Sales |
Latest Sales |
Gain/ Loss |
% Increase |
|
| 1 oz | 6,472 | 6,472 | – | – |
| 1/2 oz | 2,011 | 2,011 | – | – |
| 1/4 oz | 4,490 | 4,491 | 1 | 0.02% |
| 1/10 oz | 13,419 | 13,419 | – | – |
| 4-Coin Set | 9,976 | 9,976 | – | – |
2022 Proof American Eagle Gold Coins |
||||
| Old Sales |
Latest Sales |
Gain/ Loss |
% Increase |
|
| 1 oz | 5,913 | 5,913 | – | – |
| 1/2 oz | 1,970 | 1,970 | – | – |
| 1/4 oz | 4,464 | 4,464 | – | – |
| 1/10 oz | 13,806 | 13,806 | – | – |
| 4-Coin Set | 9,906 | 9,906 | – | – |
Uncirculated American Eagle Gold Coins |
||||
| Old Sales |
Latest Sales |
Gain/ Loss |
% Increase |
|
| 2023 | 6,221 | 6,257 | 36 | 0.58% |
| 2022 | 8,854 | 8,855 | 1 | 0.01% |
| 2021* | 8,964 | 8,964 | – | – |
| 2020* | 6,284 | 6,284 | – | – |
| 2019* | 5,851 | 5,851 | – | – |
Proof American Buffalo Gold Coins |
||||
| Old Sales |
Latest Sales |
Gain/ Loss |
% Increase |
|
| 2023 Proof Gold Buffalo | 15,074 | 15,138 | 64 | 0.42% |
| 2022 Proof Gold Buffalo | 15,943 | 15,943 | – | – |
| 2021 Proof Gold Buffalo* | 16,969 | 16,969 | – | – |
| 2020 Proof Gold Buffalo* | 11,887 | 11,887 | – | – |
| 2019 Proof Gold Buffalo* | 14,844 | 14,844 | – | – |
Barbara Bush First Spouse Gold Coins |
||||
| Old Sales |
Latest Sales |
Gain/ Loss |
% Increase |
|
| 2020-W Proof | 2,967 | 2,967 | – | – |
| 2020-W Uncirculated | 1,967 | 1,967 | – | – |
Proof American Platinum Eagle |
||||
| Old Sales |
Latest Sales |
Gain/ Loss |
% Increase |
|
| 2024 | 4,184 | 4,370 | 186 | 4.45% |
| 2023 | 8,287 | 8,292 | 5 | 0.06% |
| 2022 | 9,941 | 9,941 | – | – |
| 2021 | 9,884 | 9,884 | – | – |
| 2020 | 9,835 | 9,835 | – | – |
| 2019 | 11,268 | 11,268 | – | – |
| 2018 | 16,164 | 16,165 | 1 | 0.01% |
| 2017* | 8,890 | 8,890 | – | – |
American Palladium Eagle |
||||
| Old Sales |
Latest Sales |
Gain/ Loss |
% Increase |
|
| 2023-W Uncirculated | 5,310 | 5,321 | 11 | 0.21% |
| 2022-W Reverse Proof | 7,370 | 7,372 | 2 | 0.03% |
| 2021-W Proof | 5,170 | 5,170 | – | – |
| 2020-W Uncirculated | 9,746 | 9,746 | – | – |
| 2019-W Reverse Proof | 18,839 | 18,839 | – | – |
| 2018-W Proof* | 14,986 | 14,986 | – | – |
Presidential Silver Medals |
||||
| Old Sales |
Latest Sales |
Gain/ Loss |
% Increase |
|
| 2024 Rutherford B. Hayes Presidential Silver Medal | 11,216 | 11,225 | 9 | 0.08% |
| 2023 Ulysses S. Grant Presidential Silver Medal | 13,285 | 13,290 | 5 | 0.04% |
| 2023 Andrew Johnson Presidential Silver Medal | 12,454 | 12,462 | 8 | 0.06% |
| 2023 Abraham Lincoln Presidential Silver Medal | 18,914 | 18,927 | 13 | 0.07% |
| 2023 James Buchanan Presidential Silver Medal | 12,323 | 12,325 | 2 | 0.02% |
| 2021 Franklin Pierce Presidential Silver Medal | 12,581 | 12,583 | 2 | 0.02% |
| 2022 Millard Fillmore Presidential Silver Medal | 12,688 | 12,688 | – | – |
| 2022 Zachary Taylor Presidential Silver Medal | 13,072 | 13,072 | – | – |
| 2022 James Knox Polk Presidential Silver Medal | 13,301 | 13,303 | 2 | 0.02% |
| 2021 John Tyler Presidential Silver Medal | 13,708 | 13,711 | 3 | 0.02% |
| 2021 William Henry Harrison Presidential Silver Medal | 13,653 | 13,657 | 4 | 0.03% |
| 2021 Martin Van Buren Presidential Silver Medal | 13,798 | 13,801 | 3 | 0.02% |
| 2020 Andrew Jackson Presidential Silver Medal | 16,728 | 16,731 | 3 | 0.02% |
| 2019 John Quincy Adams Presidential Silver Medal | 14,884 | 14,885 | 1 | 0.01% |
| 2019 James Monroe Presidential Silver Medal | 15,351 | 15,353 | 2 | 0.01% |
| 2019 James Madison Presidential Silver Medal | 16,987 | 16,993 | 6 | 0.04% |
| 2019 Thomas Jefferson Presidential Silver Medal | 24,402 | 24,410 | 8 | 0.03% |
| 2018 George Washington Presidential Silver Medal | 35,403 | 35,411 | 8 | 0.02% |
| 2018 John Adams Presidential Silver Medal | 23,741 | 23,744 | 3 | 0.01% |
American Innovation Reverse Proof Sets |
||||
| Old Sales |
Latest Sales |
Gain/ Loss |
% Increase |
|
| 2023 | 37,097 | 37,181 | 84 | 0.23% |
| 2022 | 49,634 | 49,635 | 1 | 0.00% |
| 2021 | 49,547 | 49,549 | 2 | 0.00% |
2024 American Innovation Dollars – Illinois |
||||
| Old Sales |
Latest Sales |
Gain/ Loss |
% Increase |
|
| 25-coin roll set (P) | 7,219 | 7,262 | 43 | 0.60% |
| 25-coin roll set (D) | 6,655 | 6,677 | 22 | 0.33% |
| 100-coin bag (P) | 1,738 | 1,747 | 9 | 0.52% |
| 100-coin bag (D) | 1,702 | 1,717 | 15 | 0.88% |
2023 American Innovation Dollars – Mississippi |
||||
| Old Sales |
Latest Sales |
Gain/ Loss |
% Increase |
|
| 25-coin roll set (P) | 7,821 | 7,821 | – | – |
| 25-coin roll set (D) | 6,878 | 6,878 | – | – |
| 100-coin bag (P) | 2,122 | 2,130 | 8 | 0.38% |
| 100-coin bag (D) | 2,175 | 2,180 | 5 | 0.23% |
2023 American Innovation Dollars – Indiana |
||||
| Old Sales |
Latest Sales |
Gain/ Loss |
% Increase |
|
| 25-coin roll set (P) | 8,022 | 8,022 | – | – |
| 25-coin roll set (D) | 6,994 | 6,994 | – | – |
| 100-coin bag (P) | 3,004 | 3,004 | – | – |
| 100-coin bag (D) | 2,780 | 2,780 | – | – |
2023 American Innovation Dollars – Louisiana |
||||
| Old Sales |
Latest Sales |
Gain/ Loss |
% Increase |
|
| 25-coin roll set (P) | 7,989 | 7,989 | – | – |
| 25-coin roll set (D) | 6,989 | 6,989 | – | – |
| 100-coin bag (P) | 2,706 | 2,711 | 5 | 0.18% |
| 100-coin bag (D) | 2,612 | 2,622 | 10 | 0.38% |
2023 American Innovation Dollars – Ohio |
||||
| Old Sales |
Latest Sales |
Gain/ Loss |
% Increase |
|
| 25-coin roll set (P) | 8,016 | 8,016 | – | – |
| 25-coin roll set (D) | 6,978 | 6,978 | – | – |
| 100-coin bag (P) | 2,959 | 2,959 | – | – |
| 100-coin bag (D) | 2,739 | 2,739 | – | – |
2022 American Innovation Dollars – Tennessee |
||||
| Old Sales |
Latest Sales |
Gain/ Loss |
% Increase |
|
| 25-coin roll set (P) | 7,014 | 7,014 | – | – |
| 25-coin roll set (D) | 7,010 | 7,010 | – | – |
| 100-coin bag (P) | 2,781 | 2,781 | – | – |
| 100-coin bag (D) | 2,786 | 2,786 | – | – |
2022 American Innovation Dollars – Kentucky |
||||
| Old Sales |
Latest Sales |
Gain/ Loss |
% Increase |
|
| 25-coin roll set (P) | 7,009 | 7,009 | – | – |
| 25-coin roll set (D) | 6,993 | 6,993 | – | – |
| 100-coin bag (P) | 2,771 | 2,771 | – | – |
| 100-coin bag (D) | 2,779 | 2,779 | – | – |
2022 American Innovation Dollars – Vermont |
||||
| Old Sales |
Latest Sales |
Gain/ Loss |
% Increase |
|
| 25-coin roll set (P) | 7,023 | 7,023 | – | – |
| 25-coin roll set (D) | 7,011 | 7,011 | – | – |
| 100-coin bag (P) | 2,787 | 2,787 | – | – |
| 100-coin bag (D) | 2,778 | 2,778 | – | – |
2022 American Innovation Dollars – Rhode Island |
||||
| Old Sales |
Latest Sales |
Gain/ Loss |
% Increase |
|
| 25-coin roll set (P) | 7,010 | 7,010 | – | – |
| 25-coin roll set (D) | 7,007 | 7,007 | – | – |
| 100-coin bag (P) | 2,789 | 2,789 | – | – |
| 100-coin bag (D) | 2,787 | 2,787 | – | – |
2021 American Innovation Dollars – North Carolina |
||||
| Old Sales |
Latest Sales |
Gain/ Loss |
% Increase |
|
| 25-coin roll set (P) | 7,010 | 7,010 | – | – |
| 25-coin roll set (D) | 7,018 | 7,018 | – | – |
| 100-coin bag (P) | 2,789 | 2,789 | – | – |
| 100-coin bag (D) | 2,790 | 2,790 | – | – |
2021 American Innovation Dollars – New York |
||||
| Old Sales |
Latest Sales |
Gain/ Loss |
% Increase |
|
| 25-coin roll set (P) | 7,006 | 7,006 | – | – |
| 25-coin roll set (D) | 7,013 | 7,013 | – | – |
| 100-coin bag (P) | 2,786 | 2,786 | – | – |
| 100-coin bag (D) | 2,785 | 2,785 | – | – |
2021 American Innovation Dollars – Virginia |
||||
| Old Sales |
Latest Sales |
Gain/ Loss |
% Increase |
|
| 25-coin roll set (P) | 7,015 | 7,015 | – | – |
| 25-coin roll set (D) | 7,010 | 7,010 | – | – |
| 100-coin bag (P) | 2,796 | 2,796 | – | – |
| 100-coin bag (D) | 2,786 | 2,786 | – | – |
2021 American Innovation Dollars – New Hampshire |
||||
| Old Sales |
Latest Sales |
Gain/ Loss |
% Increase |
|
| 25-coin roll set (P) | 7,017 | 7,017 | – | – |
| 25-coin roll set (D) | 7,017 | 7,017 | – | – |
| 100-coin bag (P) | 2,789 | 2,789 | – | – |
| 100-coin bag (D) | 2,790 | 2,790 | – | – |
2020 American Innovation Dollars – South Carolina |
||||
| Old Sales |
Latest Sales |
Gain/ Loss |
% Increase |
|
| Reverse Proof (S) | 41,511 | 41,538 | 27 | 0.07% |
| 25-coin roll set (P) | 6,378 | 6,378 | – | – |
| 25-coin roll set (D) | 6,399 | 6,399 | – | – |
| 100-coin bag (P) | 2,734 | 2,734 | – | – |
| 100-coin bag (D) | 2,378 | 2,378 | – | – |
2020 American Innovation Dollars – Maryland |
||||
| Old Sales |
Latest Sales |
Gain/ Loss |
% Increase |
|
| Reverse Proof (S) | 49,794 | 49,794 | – | – |
| 25-coin roll set (P) | 6,493 | 6,493 | – | – |
| 25-coin roll set (D) | 6,471 | 6,471 | – | – |
| 100-coin bag (P) | 2,725 | 2,725 | – | – |
| 100-coin bag (D) | 2,737 | 2,737 | – | – |
2020 American Innovation Dollars – Massachusetts |
||||
| Old Sales |
Latest Sales |
Gain/ Loss |
% Increase |
|
| Reverse Proof (S) | 49,409 | 49,432 | 23 | 0.05% |
| 25-coin roll set (P) | 6,486 | 6,486 | – | – |
| 25-coin roll set (D) | 6,481 | 6,481 | – | – |
| 100-coin bag (P) | 2,746 | 2,746 | – | – |
| 100-coin bag (D) | 2,744 | 2,744 | – | – |
2020 American Innovation Dollars – Connecticut |
||||
| Old Sales |
Latest Sales |
Gain/ Loss |
% Increase |
|
| Reverse Proof (S) | 46,975 | 47,001 | 26 | 0.06% |
| 25-coin roll set (P) | 6,496 | 6,496 | – | – |
| 25-coin roll set (D) | 6,425 | 6,425 | – | – |
| 100-coin bag (P) | 2,736 | 2,736 | – | – |
| 100-coin bag (D) | 2,747 | 2,747 | – | – |
2019 American Innovation Dollars – Georgia |
||||
| Old Sales |
Latest Sales |
Gain/ Loss |
% Increase |
|
| Reverse Proof (S) | 47,344 | 47,374 | 30 | 0.06% |
| 25-coin roll set (P) | 8,092 | 8,092 | – | – |
| 25-coin roll set (D) | 7,542 | 7,542 | – | – |
| 100-coin bag (P) | 3,459 | 3,459 | – | – |
| 100-coin bag (D) | 3,324 | 3,330 | 6 | 0.18% |
2019 American Innovation Dollars – New Jersey |
||||
| Old Sales |
Latest Sales |
Gain/ Loss |
% Increase |
|
| Reverse Proof (S) | 50,805 | 50,841 | 36 | 0.07% |
| 25-coin roll set (P) | 9,102 | 9,102 | – | – |
| 25-coin roll set (D) | 8,043 | 8,043 | – | – |
| 100-coin bag (P) | 3,941 | 3,941 | – | – |
| 100-coin bag (D) | 3,586 | 3,586 | – | – |
2019 American Innovation Dollars – Pennsylvania |
||||
| Old Sales |
Latest Sales |
Gain/ Loss |
% Increase |
|
| Reverse Proof (S) | 55,265 | 55,297 | 32 | 0.06% |
| 25-coin roll set (P) | 10,457 | 10,457 | – | – |
| 25-coin roll set (D) | 8,536 | 8,536 | – | – |
| 100-coin bag (P) | 3,689 | 3,689 | – | – |
| 100-coin bag (D) | 3,055 | 3,055 | – | – |
2019 American Innovation Dollars – Delaware |
||||
| Old Sales |
Latest Sales |
Gain/ Loss |
% Increase |
|
| Reverse Proof (S) | 70,771 | 70,797 | 26 | 0.04% |
| 25-coin roll set (P) | 9,107 | 9,107 | – | – |
| 25-coin roll set (D) | 8,372 | 8,372 | – | – |
| 100-coin bag (P) | 3,203 | 3,203 | – | – |
| 100-coin bag (D) | 3,385 | 3,385 | – | – |
2018 American Innovation Dollars |
||||
| Old Sales |
Latest Sales |
Gain/ Loss |
% Increase |
|
| Reverse Proof (S)* | 74,720 | 74,720 | – | – |
| Proof Coin (S) | 254,112 | 254,112 | – | – |
| 25-coin roll set (P) | 22,903 | 22,903 | – | – |
| 25-coin roll set (D) | 25,725 | 25,725 | – | – |
| 100-coin bag (P)* | 2,935 | 2,935 | – | – |
| 100-coin bag (D)* | 2,954 | 2,954 | – | – |
George H.W. Bush Coin & Chronicles Set |
||||
| Old Sales |
Latest Sales |
Gain/ Loss |
% Increase |
|
| $1 Coin & Set | 11,512 | 11,512 | – | – |
2020 Bush Presidential $1 Coin & First Spouse Medal Set |
||||
| Old Sales |
Latest Sales |
Gain/ Loss |
% Increase |
|
| $1 Coin & Set | 9,876 | 9,876 | – | – |
2020 George H.W. Bush Presidential $1 Coins |
||||
| Old Sales |
Latest Sales |
Gain/ Loss |
% Increase |
|
| 25-coin roll (P) | 24,922 | 24,922 | – | – |
| 25-coin roll (D) | 23,204 | 23,231 | 27 | 0.12% |
| 100-coin bag (P) | 2,695 | 2,695 | – | – |
| 100-coin bag (D) | 2,098 | 2,098 | – | – |
| 250-coin bag (P) | 2,998 | 3,001 | 3 | 0.10% |
| 250-coin bag (D) | 4,572 | 4,576 | 4 | 0.09% |
Native American Dollar Rolls |
||||
| Old Sales |
Latest Sales |
Gain/ Loss |
% Increase |
|
| 2024-P Native American $1 25 Coin Roll | 11,047 | 11,163 | 116 | 1.05% |
| 2024-D Native American $1 25 Coin Roll | 10,886 | 10,983 | 97 | 0.89% |
| 2024-P Native American $1 100-Coin Bag | 1,511 | 1,539 | 28 | 1.85% |
| 2024-D Native American $1 100-Coin Bag | 1,399 | 1,421 | 22 | 1.57% |
| 2024-P Native American $1 250-Coin Box | 716 | 728 | 12 | 1.68% |
| 2024-D Native American $1 250-Coin Box | 786 | 791 | 5 | 0.64% |
| 2023-P Native American $1 25 Coin Roll | 13,917 | 13,917 | – | – |
| 2023-D Native American $1 25 Coin Roll | 13,945 | 13,945 | – | – |
| 2023-P Native American $1 100-Coin Bag | 1,695 | 1,695 | – | – |
| 2023-D Native American $1 100-Coin Bag | 1,694 | 1,694 | – | – |
| 2023-P Native American $1 250-Coin Box | 1,467 | 1,475 | 8 | 0.55% |
| 2023-D Native American $1 250-Coin Box | 1,596 | 1,596 | – | – |
| 2022-P Native American $1 25 Coin Roll | 13,996 | 13,996 | – | – |
| 2022-D Native American $1 25 Coin Roll | 13,964 | 13,964 | – | – |
| 2022-P Native American $1 100-Coin Bag | 1,699 | 1,699 | – | – |
| 2022-D Native American $1 100-Coin Bag | 1,614 | 1,614 | – | – |
| 2022-P Native American $1 250-Coin Box | 1,698 | 1,698 | – | – |
| 2022-D Native American $1 250-Coin Box | 1,699 | 1,699 | – | – |
Kennedy Half Dollar Rolls |
||||
| Old Sales |
Latest Sales |
Gain/ Loss |
% Increase |
|
| 2023-dated 200-coin bag (P&D) | 11,146 | 11,146 | – | – |
| 2023-dated 2-roll set (P&D) | 24,987 | 24,987 | – | – |
| 2022-dated 200-coin bag (P&D) | 10,999 | 10,999 | – | – |
| 2022-dated 2-roll set (P&D) | 21,926 | 21,926 | – | – |
| 2021-dated 200-coin bag (P&D)* | 9,976 | 9,976 | – | – |
| 2021-dated 2-roll set (P&D)* | 21,989 | 21,989 | – | – |
| 2020-dated 200-coin bag (P&D)* | 11,776 | 11,776 | – | – |
| 2020-dated 2-roll set (P&D)* | 24,312 | 24,312 | – | – |
| 2019-dated 200-coin bag (P&D)* | 11,534 | 11,534 | – | – |
| 2019-dated 2-roll set (P&D)* | 24,132 | 24,132 | – | – |
2024 Patsy Takemoto Mink Quarters |
||||
| Old Sales |
Latest Sales |
Gain/ Loss |
% Increase |
|
| Three-Roll Set | 11,177 | 11,497 | 320 | 2.86% |
| 100-Coin Bag (P) | 1,865 | 1,926 | 61 | 3.27% |
| 100-Coin Bag (D) | 1,591 | 1,650 | 59 | 3.71% |
| Two-Roll Set | 2,905 | 2,955 | 50 | 1.72% |
2024 Rev. Dr. Pauli Murray Quarters |
||||
| Old Sales |
Latest Sales |
Gain/ Loss |
% Increase |
|
| Three-Roll Set | 11,529 | 11,572 | 43 | 0.37% |
| 100-Coin Bag (P) | 1,570 | 1,583 | 13 | 0.83% |
| 100-Coin Bag (D) | 1,328 | 1,339 | 11 | 0.83% |
| Two-Roll Set | 2,727 | 2,746 | 19 | 0.70% |
2023 Maria Tallchief Quarters |
||||
| Old Sales |
Latest Sales |
Gain/ Loss |
% Increase |
|
| Three-Roll Set | 12,433 | 12,433 | – | – |
| 100-Coin Bag (P) | 1,903 | 1,908 | 5 | 0.26% |
| 100-Coin Bag (D) | 1,701 | 1,704 | 3 | 0.18% |
| Two-Roll Set | 3,371 | 3,384 | 13 | 0.39% |
2023 Jovita Idar Quarters |
||||
| Old Sales |
Latest Sales |
Gain/ Loss |
% Increase |
|
| Three-Roll Set | 12,585 | 12,585 | – | – |
| 100-Coin Bag (P) | 3,895 | 3,899 | 4 | 0.10% |
| 100-Coin Bag (D) | 3,534 | 3,545 | 11 | 0.31% |
| Two-Roll Set | 3,705 | 3,715 | 10 | 0.27% |
2023 Eleanor Roosevelt Quarters |
||||
| Old Sales |
Latest Sales |
Gain/ Loss |
% Increase |
|
| Three-Roll Set | 12,678 | 12,678 | – | – |
| 100-Coin Bag (P) | 4,246 | 4,252 | 6 | 0.14% |
| 100-Coin Bag (D) | 3,932 | 3,932 | – | – |
| Two-Roll Set | 4,414 | 4,421 | 7 | 0.16% |
2023 Edith Kanakaʻole Quarters |
||||
| Old Sales |
Latest Sales |
Gain/ Loss |
% Increase |
|
| Three-Roll Set | 12,585 | 12,585 | – | – |
| 100-Coin Bag (P) | 7,194 | 7,202 | 8 | 0.11% |
| 100-Coin Bag (D) | 4,522 | 4,523 | 1 | 0.02% |
| Two-Roll Set | 5,633 | 5,646 | 13 | 0.23% |
2023 Bessie Coleman Quarters |
||||
| Old Sales |
Latest Sales |
Gain/ Loss |
% Increase |
|
| Three-Roll Set | 12,509 | 12,509 | – | – |
| 100-Coin Bag (P) | 5,568 | 5,572 | 4 | 0.07% |
| 100-Coin Bag (D) | 4,893 | 4,897 | 4 | 0.08% |
| Two-Roll Set | 5,793 | 5,802 | 9 | 0.16% |
2022 Anna May Wong Quarters |
||||
| Old Sales |
Latest Sales |
Gain/ Loss |
% Increase |
|
| Three-Roll Set | 7,617 | 7,617 | – | – |
| 100-Coin Bag (P) | 1,860 | 1,860 | – | – |
| 100-Coin Bag (D) | 1,858 | 1,858 | – | – |
| Two-Roll Set | 5,936 | 5,936 | – | – |
2022 Nina Otero-Warren Quarters |
||||
| Old Sales |
Latest Sales |
Gain/ Loss |
% Increase |
|
| Three-Roll Set | 7,639 | 7,639 | – | – |
| 100-Coin Bag (P) | 1,856 | 1,856 | – | – |
| 100-Coin Bag (D) | 1,855 | 1,855 | – | – |
| Two-Roll Set | 5,890 | 5,890 | – | – |
2022 Wilma Mankiller Quarters |
||||
| Old Sales |
Latest Sales |
Gain/ Loss |
% Increase |
|
| Three-Roll Set | 7,616 | 7,616 | – | – |
| 100-Coin Bag (P) | 1,854 | 1,854 | – | – |
| 100-Coin Bag (D) | 1,833 | 1,833 | – | – |
| Two-Roll Set | 5,918 | 5,918 | – | – |
2022 Dr. Sally Ride Quarters |
||||
| Old Sales |
Latest Sales |
Gain/ Loss |
% Increase |
|
| Three-Roll Set | 7,603 | 7,603 | – | – |
| 100-Coin Bag (P) | 1,854 | 1,854 | – | – |
| 100-Coin Bag (D) | 1,852 | 1,852 | – | – |
| Two-Roll Set | 5,926 | 5,926 | – | – |
2022 Maya Angelou Quarters |
||||
| Old Sales |
Latest Sales |
Gain/ Loss |
% Increase |
|
| Three-Roll Set | 7,588 | 7,588 | – | – |
| 100-Coin Bag (P) | 1,858 | 1,858 | – | – |
| 100-Coin Bag (D) | 1,861 | 1,861 | – | – |
| Two-Roll Set | 5,940 | 5,940 | – | – |


