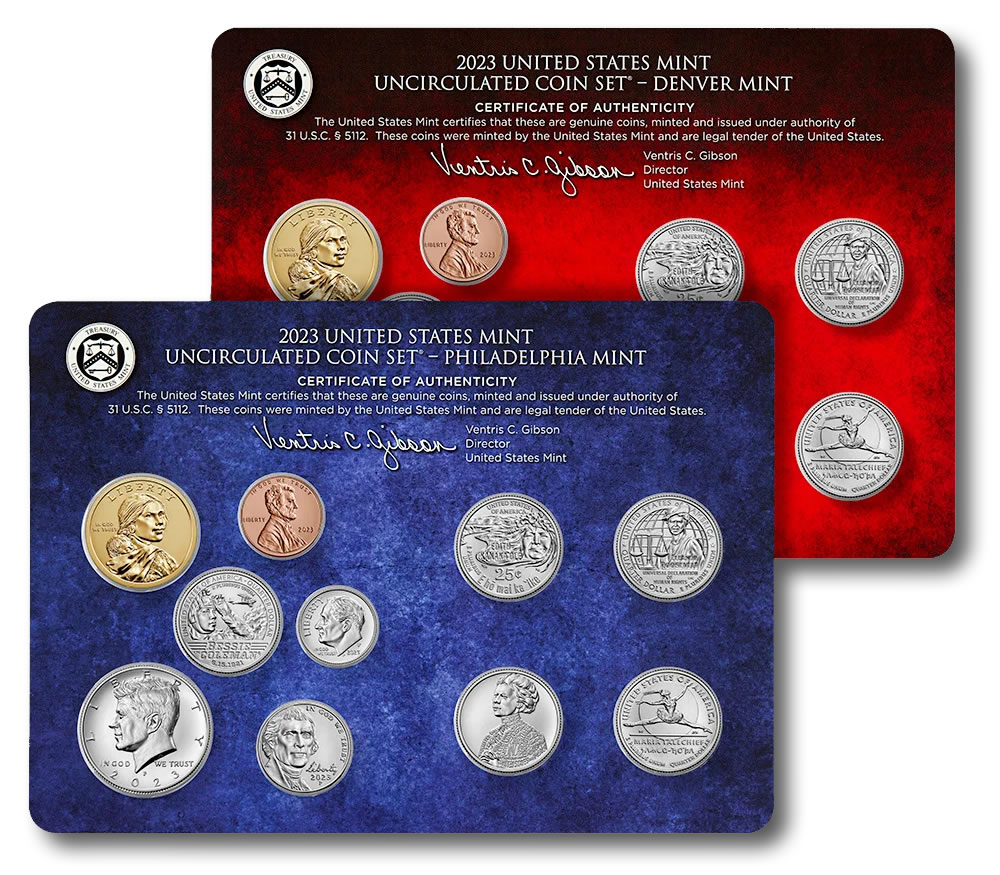
The recently released uncirculated 2023 Mint Set jumped out of the starting gate according to the latest sales figures from the United States Mint.
Released on Dec. 5 for $29, the annually issued set of uncirculated coins achieved six-day starting sales of 164,710, securing its position as the top weekly seller for the U.S. Mint.
The start was one of the best among sets released since at least 2007 when CoinNews began keeping track, and it closely followed last year’s set, which ranked as the second quickest overall. The uncirculated 2020 Mint Set takes the lead in terms of initial sales, with an opening figure of 191,076. This set had a built-in advantage, with an early and very publicly stated limited production of 213,000 sets "due to the effects of COVID-19." This instantly made it the rarest of sets since 1959 when 187,000 were sold.
It’s somewhat surprising that, at least in the early stages, a low production run has not boosted this year’s set to the extent seen in the 2020 edition. This year’s set has a stated product limit of only 185,000 units. If all are sold, the set’s mintage would still be the lowest since 1958 when 50,314 sets were sold.
For reference, last year’s set was restricted to 250,000, while the mintage for the 2021 Mint Set is listed as "unlimited." Both older sets are still available, as indicated by the "*" notations in the below table.
Debut Sales of 2007 – 2023 Mint Sets
| Issue Price | Included Coins | Issue Date | Debut Sales Date | Debut Sales | Ending Sales (Unaudited) | |
| 2023 Mint Set | $29.00 | 20 | Dec. 5, 2023 | Dec. 10, 2023 | 164,129 | – |
| 2022 Mint Set | $25.25 | 20 | July 12, 2022 | July 17, 2022 | 164,710 | 247,539* |
| 2021 Mint Set | $25.25 | 14 | Sept. 28, 2021 | Oct. 3, 2021 | 153,895 | 227,221* |
| 2020 Mint Set | $25.25 | 20 | Nov. 30, 2020 | Dec. 6, 2020 | 191,076 | 211,787 |
| 2019 Mint Set | $21.95 | 20 (not including bonus cent) | May 14, 2019 | May 19, 2019 | 161,598 | 346,117 |
| 2018 Mint Set | $21.95 | 20 | May 14, 2018 | May 20, 2018 | 126,691 | 257,536 |
| 2017 Mint Set | $20.95 | 20 | May 17, 2017 | May 21, 2017 | 131,392 | 286,813 |
| 2016 Mint Set | $26.95 | 26 | May, 18, 2016 | May 22, 2016 | 127,489 | 296,576 |
| 2015 Mint Set | $28.95 | 28 | April 27, 2015 | May 3, 2015 | 144,137 | 314,029 |
| 2014 Mint Set | $27.95 | 28 | May 13, 2014 | May 18, 2014 | 157,044 | 345,813 |
| 2013 US Mint Set | $27.95 | 28 | June 4, 2013 | June 10, 2013 | 157,783 | 376,844 |
| 2012 Mint Set | $27.95 | 28 | May 21, 2012 | May 28, 2012 | 164,459 | 392,224 |
| 2011 Mint Set | $31.95 | 28 | February 8, 2011 | February 13, 2011 | 191,391 | 533,529 |
| 2010 Mint Set | $31.95 | 28 | July 15, 2010 | July 18, 2010 | 200,764 | 583,912 |
| 2009 Mint Set | $27.95 | 36 | October 1, 2009 | October 4, 2009 | 297,842 | 774,844 |
| 2008 Mint Set | $22.95 | 28 | July 30, 2008 | August 3, 2008 | 234,762 | 745,464 |
| 2007 Mint Set | $22.95 | 28 | October 9, 2007 | October 14, 2007 | 361,578 | 895,628 |
*The sets from 2021 and 2022 are still available.
U.S. Mint Top Sellers
Here is the roster of the U.S. Mint’s most sought-after numismatic products for the week ending on Dec. 10:
- 2023 Mint Set (+164,129)
- 2023Proof Set (+9,109 to 362,509)
- 2023 Silver Proof Set (+3,173 to 183,262)
- 2023-S Proof Morgan Silver Dollar (+2,259 to 331,442)
- 2023 Limited Edition Silver Proof Set (+1,981 to 20,099)
- 2023-S Proof Peace Silver Dollar (+1,833 to 302,642)
- 2023-S Proof Silver Eagle (+1,799 to 172,838)
- 2022 Mint Set (+1,380 to 247,539)
- 2023 American Innovation Dollar Proof Set (+1,254 to 50,352)
- 2023 American Innovation Dollar Reverse Proof Set (+1,101 to 34,325)
In its latest report, the U.S. Mint published sales data for 396 numismatic products. Excluding the new set, nine products experienced an increase of over 1,000 units, which, while historically significant, fell short of the eleven products recorded in the previous report – a number that hadn’t been surpassed in nearly two years.
Additionally, three products recorded negative weekly sales, compared to four in the previous sales report. Two of the reductions were by one each, while the 2023-S Morgan & Peace Silver Dollar Reverse Proof Set dropped by 738 units to a total of 200,691.
US Mint Sales: Numismatic Products
Below are tables showing the latest available sales for U.S. Mint numismatic products. The sales period covers from Dec. 4 to Dec. 10. Products with an asterisk (*) are no longer available or had no reported sales.
Morgan & Peace Silver Dollars | ||||
| Old Sales | Latest Sales | Gain/ Loss | % Increase | |
| 2023-S Morgan & Peace Silver Dollar Reverse Proof Set | 201,429 | 200,691 | -738 | -0.37% |
| 2023-S Proof Morgan Silver Dollar | 329,183 | 331,442 | 2,259 | 0.69% |
| 2023-S Proof Morgan Silver Dollar (Bulk – 40 Coins) | 443 | 443 | – | – |
| 2023-S Proof Peace Silver Dollar | 300,809 | 302,642 | 1,833 | 0.61% |
| 2023-S Proof Peace Silver Dollar (Bulk – 40 Coins) | 438 | 438 | – | – |
| 2023-P Uncirculated Morgan Silver Dollar | 260,432 | 260,432 | – | – |
| 2023-P Uncirculated Morgan Silver Dollar (40 – Bulk) | 330 | 330 | – | – |
| 2023-P Uncirculated Peace Silver Dollar | 258,813 | 258,814 | 1 | 0.00% |
| 2023-P Uncirculated Peace Silver Dollar (40 – Bulk) | 338 | 338 | – | – |
Armed Forces Silver Medals | ||||
| Old Sales | Latest Sales | Gain/ Loss | % Increase | |
| U.S. Army 2.5 Ounce Silver Medal | 9,988 | 9,988 | – | – |
| U.S. Marine Corps 2.5 Ounce Silver Medal | 9,575 | 9,575 | – | – |
| U.S. Navy 2.5 Ounce Silver Medal | 9,987 | 9,987 | – | – |
| U.S. Coast Guard 2.5 Ounce Silver Medal | 9,955 | 9,955 | – | – |
| U.S. Air Force 2.5 Ounce Silver Medal | 9,953 | 9,953 | – | – |
| U.S. Marine Corps 1 Ounce Silver Medal | 17,538 | 17,657 | 119 | 0.68% |
| U.S. Navy 1 Ounce Silver Medal | 19,222 | 19,333 | 111 | 0.58% |
| U.S. Coast Guard 1 Ounce Silver Medal | 17,267 | 17,316 | 49 | 0.28% |
| U.S. Air Force 1 Ounce Silver Medal | 19,378 | 19,472 | 94 | 0.49% |
American Liberty Products | ||||
| Old Sales | Latest Sales | Gain/ Loss | % Increase | |
| 2023-W $100 American Liberty Gold Coin | 12,133 | 12,134 | 1 | 0.01% |
| 2023-P American Liberty Silver Medal | 29,502 | 29,849 | 347 | 1.18% |
| 2022-P American Liberty Silver Medal | 74,292 | 74,294 | 2 | 0.00% |
| 2021-W $100 American Liberty Gold Coin | 12,471 | 12,471 | – | – |
| 2019-W $100 American Liberty Gold Coin | 24,609 | 24,609 | – | – |
| 2019-P American Liberty Silver Medal | 44,928 | 44,928 | – | – |
| 2018-W $10 American Liberty Gold Coin | 58,062 | 58,247 | 185 | 0.32% |
| 2017 American Liberty Silver Four-Medal Set* | 32,647 | 32,647 | – | – |
| 2017-S Enhanced Uncirculated Coin Set* | 210,419 | 210,419 | – | – |
| 2017-W $100 American Liberty Gold Coin | 39,011 | 39,026 | 15 | 0.04% |
| 2017-P Proof American Liberty Silver Medal* | 55,187 | 55,187 | – | – |
Clad Proof Sets | ||||
| Old Sales | Latest Sales | Gain/ Loss | % Increase | |
| 2023 Proof Set | 353,400 | 362,509 | 9,109 | 2.58% |
| 2022 Proof Set | 400,007 | 400,013 | 6 | 0.00% |
| 2021 Proof Set | 512,731 | 512,735 | 4 | 0.00% |
| 2020 Proof Set* | 464,658 | 464,658 | – | – |
| 2019 Proof Set* | 601,363 | 601,363 | – | – |
| 2018 Proof Set* | 517,081 | 517,081 | – | – |
| 2017 Proof Set* | 568,678 | 568,678 | – | – |
| 2023 American Innovation Dollars Proof Set | 49,098 | 50,352 | 1,254 | 2.55% |
| 2022 American Innovation Dollars Proof Set | 77,960 | 78,088 | 128 | 0.16% |
| 2021 American Innovation Dollars Proof Set | 84,604 | 84,604 | – | – |
| 2020 American Innovation Dollars Proof Set | 107,052 | 107,052 | – | – |
| 2019 American Innovation Dollars Proof Set | 147,602 | 147,699 | 97 | 0.07% |
| 2023 American Women Quarters Proof Set | 52,857 | 53,457 | 600 | 1.14% |
| 2022 American Women Quarters Proof Set* | 42,821 | 42,821 | – | – |
| 2020 America the Beautiful Quarters Proof Set* | 64,242 | 64,242 | – | – |
| 2019 America the Beautiful Quarters Proof Set | 84,228 | 84,308 | 80 | 0.09% |
| 2018 America the Beautiful Quarters Proof Set* | 86,697 | 86,697 | – | – |
Silver Proof Sets | ||||
| Old Sales | Latest Sales | Gain/ Loss | % Increase | |
| 2023 Silver Proof Set | 180,089 | 183,262 | 3,173 | 1.76% |
| 2022 Silver Proof Set | 246,395 | 246,594 | 199 | 0.08% |
| 2021 Silver Proof Set | 301,738 | 301,800 | 62 | 0.02% |
| 2020 Silver Proof Set* | 313,183 | 313,183 | – | – |
| 2019 Silver Proof Set* | 412,708 | 412,708 | – | – |
| 2018 Silver Proof Set* | 332,273 | 332,273 | – | – |
| 2018 Silver Reverse Proof Set* | 199,116 | 199,116 | – | – |
| 2023 American Women Quarters Silver Proof Set | 43,734 | 43,916 | 182 | 0.42% |
| 2022 American Women Quarters Silver Proof Set | 57,682 | 57,685 | 3 | 0.01% |
| 2020 America the Beautiful Quarters Silver Proof Set* | 64,012 | 64,012 | – | – |
| 2019 America the Beautiful Quarters Silver Proof Set* | 78,585 | 78,585 | – | – |
| 2018 America the Beautiful Quarters Silver Proof Set* | 79,301 | 79,301 | – | – |
| 2023 Congratulations Gift Set | 39,101 | 39,102 | 1 | 0.00% |
| 2022 Congratulations Gift Set | 29,710 | 29,710 | – | – |
| 2021 Congratulations Gift Set* | 39,997 | 39,997 | – | – |
| 2020 Congratulations Gift Set* | 24,468 | 24,468 | – | – |
| 2019 Congratulations Gift Set* | 31,638 | 31,638 | – | – |
| 2023 Limited Edition Silver Proof Set | 18,118 | 20,099 | 1,981 | 10.93% |
| 2022 Limited Edition Silver Proof Set | 49,374 | 49,484 | 110 | 0.22% |
| 2021 Limited Edition Silver Proof Set | 48,712 | 48,712 | – | – |
| 2020 Limited Edition Silver Proof Set* | 50,061 | 50,061 | – | – |
US Mint Uncirculated Sets | ||||
| Old Sales | Latest Sales | Gain/ Loss | % Increase | |
| 2023 Uncirculated Mint Set | – | 164,129 | – | – |
| 2022 Uncirculated Mint Set | 246,159 | 247,539 | 1,380 | 0.56% |
| 2021 Uncirculated Mint Set | 226,743 | 227,221 | 478 | 0.21% |
| 2020 Uncirculated Mint Set* | 211,787 | 211,787 | – | – |
| 2019 Uncirculated Mint Set* | 346,117 | 346,117 | – | – |
| 2018 Uncirculated Mint Set* | 257,536 | 257,536 | – | – |
| 2017 Uncirculated Mint Set* | 286,813 | 286,813 | – | – |
Kids Coin Sets | ||||
| Old Sales | Latest Sales | Gain/ Loss | % Increase | |
| 2019 Youth Coin and Currency Set | 24,880 | 24,880 | – | – |
| 2019 Explore and Discover Coin Set | 43,177 | 43,310 | 133 | 0.31% |
| 2019 Rocketship* | 49,921 | 49,921 | – | – |
| 2014 Coin Discovery Set* | 13,151 | 13,151 | – | – |
Ornaments | ||||
| Old Sales | Latest Sales | Gain/ Loss | % Increase | |
| 2023 U.S. Mint Ornament | 4,361 | 4,604 | 243 | 5.57% |
| 2023 Mighty Minters Ornament | 2,745 | 2,863 | 118 | 4.30% |
| 2022 U.S. Mint Ornament | 5,619 | 5,648 | 29 | 0.52% |
| 2022 Mighty Minters Ornament | 4,048 | 4,058 | 10 | 0.25% |
| 2023 Bessie Coleman Ornament | 1,132 | 1,168 | 36 | 3.18% |
| 2023 Edith Kanakaʻole Ornament; | 1,308 | 1,337 | 29 | 2.22% |
| 2023 Eleanor Roosevelt Ornament | 1,519 | 1,571 | 52 | 3.42% |
| 2023 Jovita Idar Ornament | 1,147 | 1,176 | 29 | 2.53% |
| 2023 Maria Tallchief Ornament | 1,353 | 1,395 | 42 | 3.10% |
| 2022 Maya Angelou Ornament | 3,121 | 3,148 | 27 | 0.87% |
| 2022 Dr. Sally Ride Ornament | 3,228 | 3,245 | 17 | 0.53% |
| 2022 Wilma Mankiller Ornament | 2,241 | 2,259 | 18 | 0.80% |
| 2022 Nina Otero-Warren Ornament | 1,790 | 1,796 | 6 | 0.34% |
| 2022 Anna May Wong Ornament | 3,174 | 3,192 | 18 | 0.57% |
| 2021 Mighty Minters Ornament | 4,821 | 4,821 | – | – |
| 2021 U.S. Mint Ornament | 7,933 | 7,949 | 16 | 0.20% |
| 2020 Mighty Minters Ornament | 4,538 | 4,550 | 12 | 0.26% |
| 2020 U.S. Mint Ornament | 6,635 | 6,653 | 18 | 0.27% |
| 2019 Mighty Minters Ornament | 7,075 | 7,081 | 6 | 0.08% |
| 2019 U.S. Mint Ornament | 11,875 | 11,900 | 25 | 0.21% |
Proof & Reverse Proof Silver Eagles | ||||
| Old Sales | Latest Sales | Gain/ Loss | % Increase | |
| 2023-S Proof Silver Eagle | 171,039 | 172,838 | 1,799 | 1.05% |
| 2023-S Proof Silver Eagle (Bulk – 40 Coins) | 743 | 743 | – | – |
| 2022-S Proof Silver Eagle | 199,698 | 199,698 | – | – |
| 2022-S Proof Silver Eagle (Bulk – 40 Coins) | 2,925 | 2,925 | – | – |
| 2023-W Proof Silver Eagle | 436,010 | 436,113 | 103 | 0.02% |
| 2023-W Proof Silver Eagle (Bulk – 40 Coins) | 2,119 | 2,119 | – | – |
| 2022-W Proof Silver Eagle | 496,993 | 496,993 | – | – |
| 2022-W Proof Silver Eagle (Bulk – 40 Coins) | 4,106 | 4,106 | – | – |
| 2021 Reverse Proof American Silver Eagle Two-Coin Set* | 124,917 | 124,917 | – | – |
| 2021-S Proof Silver Eagle, Type 2* | 199,744 | 199,744 | – | – |
| 2021-S Proof Silver Eagle, Type 2 (Bulk – 40 Coins)* | 652 | 652 | – | – |
| 2021-W Proof Silver Eagle, Type 2* | 300,096 | 300,096 | – | – |
| 2021-W Proof Silver Eagle, Type 2 (Bulk – 40 Coins)* | 2,142 | 2,142 | – | – |
| 2021-W Proof Silver Eagle, Type 1* | 299,898 | 299,898 | – | – |
| 2021-W Proof Silver Eagle, Type 1 (Bulk – 40 Coins)* | 686 | 686 | – | – |
Uncirculated Silver Eagles | ||||
| Old Sales | Latest Sales | Gain/ Loss | % Increase | |
| 2023 | 134,338 | 134,906 | 568 | 0.42% |
| 2022 | 160,053 | 160,053 | – | – |
| 2022 Bulk 40 | 987 | 987 | – | – |
| 2021* | 174,932 | 174,932 | – | – |
| 2021 Bulk 40* | 324 | 324 | – | – |
2023 Proof American Eagle Gold Coins | ||||
| Old Sales | Latest Sales | Gain/ Loss | % Increase | |
| 1 oz | 6,455 | 6,455 | – | – |
| 1/2 oz | 2,000 | 2,000 | – | – |
| 1/4 oz | 4,477 | 4,478 | 1 | 0.02% |
| 1/10 oz | 13,416 | 13,416 | – | – |
| 4-Coin Set | 9,408 | 9,408 | – | – |
2022 Proof American Eagle Gold Coins | ||||
| Old Sales | Latest Sales | Gain/ Loss | % Increase | |
| 1 oz | 5,913 | 5,913 | – | – |
| 1/2 oz | 1,970 | 1,970 | – | – |
| 1/4 oz | 4,464 | 4,464 | – | – |
| 1/10 oz | 13,806 | 13,806 | – | – |
| 4-Coin Set | 9,906 | 9,906 | – | – |
Uncirculated American Eagle Gold Coins | ||||
| Old Sales | Latest Sales | Gain/ Loss | % Increase | |
| 2023 | 5,683 | 5,767 | 84 | 1.48% |
| 2022 | 8,848 | 8,848 | – | – |
| 2021* | 8,943 | 8,954 | 11 | 0.12% |
| 2020* | 6,284 | 6,284 | – | – |
| 2019* | 5,851 | 5,851 | – | – |
| 2018* | 8,518 | 8,518 | – | – |
| 2017* | 5,800 | 5,800 | – | – |
Proof American Buffalo Gold Coins | ||||
| Old Sales | Latest Sales | Gain/ Loss | % Increase | |
| 2023 Proof Gold Buffalo | 13,891 | 14,007 | 116 | 0.84% |
| 2022 Proof Gold Buffalo | 15,943 | 15,943 | – | – |
| 2021 Proof Gold Buffalo* | 16,969 | 16,969 | – | – |
| 2020 Proof Gold Buffalo* | 11,887 | 11,887 | – | – |
| 2019 Proof Gold Buffalo* | 14,844 | 14,844 | – | – |
| 2018 Proof Gold Buffalo* | 15,756 | 15,756 | – | – |
| 2017 Proof Gold Buffalo* | 15,810 | 15,810 | – | – |
Proof American Platinum Eagle | ||||
| Old Sales | Latest Sales | Gain/ Loss | % Increase | |
| 2023 | 8,098 | 8,113 | 15 | 0.19% |
| 2022 | 9,940 | 9,940 | – | – |
| 2021 | 9,884 | 9,884 | – | – |
| 2020 | 9,835 | 9,835 | – | – |
| 2019 | 11,268 | 11,268 | – | – |
| 2018 | 16,100 | 16,106 | 6 | 0.04% |
| 2017* | 8,890 | 8,890 | – | – |
American Palladium Eagle | ||||
| Old Sales | Latest Sales | Gain/ Loss | % Increase | |
| 2023-W Uncirculated | 4,974 | 5,010 | 36 | 0.72% |
| 2022-W Reverse Proof | 7,367 | 7,367 | – | – |
| 2021-W Proof | 5,170 | 5,170 | – | – |
| 2020-W Uncirculated | 9,746 | 9,746 | – | – |
| 2019-W Reverse Proof | 18,833 | 18,833 | – | – |
| 2018-W Proof* | 14,986 | 14,986 | – | – |
Presidential Silver Medals | ||||
| Old Sales | Latest Sales | Gain/ Loss | % Increase | |
| 2023 Ulysses S. Grant Presidential Silver Medal | 12,836 | 12,882 | 46 | 0.36% |
| 2023 Andrew Johnson Presidential Silver Medal | 12,221 | 12,242 | 21 | 0.17% |
| 2023 Abraham Lincoln Presidential Silver Medal | 18,340 | 18,385 | 45 | 0.25% |
| 2023 James Buchanan Presidential Silver Medal | 12,165 | 12,173 | 8 | 0.07% |
| 2021 Franklin Pierce Presidential Silver Medal | 12,448 | 12,457 | 9 | 0.07% |
| 2022 Millard Fillmore Presidential Silver Medal | 12,575 | 12,584 | 9 | 0.07% |
| 2022 Zachary Taylor Presidential Silver Medal | 12,957 | 12,965 | 8 | 0.06% |
| 2022 James Knox Polk Presidential Silver Medal | 13,189 | 13,197 | 8 | 0.06% |
| 2021 John Tyler Presidential Silver Medal | 13,599 | 13,608 | 9 | 0.07% |
| 2021 William Henry Harrison Presidential Silver Medal | 13,538 | 13,546 | 8 | 0.06% |
| 2021 Martin Van Buren Presidential Silver Medal | 13,693 | 13,700 | 7 | 0.05% |
| 2020 Andrew Jackson Presidential Silver Medal | 16,605 | 16,610 | 5 | 0.03% |
| 2019 John Quincy Adams Presidential Silver Medal | 14,741 | 14,746 | 5 | 0.03% |
| 2019 James Monroe Presidential Silver Medal | 15,236 | 15,243 | 7 | 0.05% |
| 2019 James Madison Presidential Silver Medal | 16,844 | 16,851 | 7 | 0.04% |
| 2019 Thomas Jefferson Presidential Silver Medal | 24,167 | 24,183 | 16 | 0.07% |
| 2018 George Washington Presidential Silver Medal | 35,015 | 35,030 | 15 | 0.04% |
| 2018 John Adams Presidential Silver Medal | 23,596 | 23,601 | 5 | 0.02% |
American Innovation Reverse Proof Sets | ||||
| Old Sales | Latest Sales | Gain/ Loss | % Increase | |
| 2023 | 33,224 | 34,325 | 1,101 | 3.31% |
| 2022 | 49,482 | 49,485 | 3 | 0.01% |
| 2021 | 49,541 | 49,541 | – | – |
2023 American Innovation Dollars – Mississippi | ||||
| Old Sales | Latest Sales | Gain/ Loss | % Increase | |
| 25-coin roll set (P) | 7,388 | 7,418 | 30 | 0.41% |
| 25-coin roll set (D) | 6,701 | 6,719 | 18 | 0.27% |
| 100-coin bag (P) | 1,981 | 1,993 | 12 | 0.61% |
| 100-coin bag (D) | 1,995 | 2,017 | 22 | 1.10% |
2023 American Innovation Dollars – Indiana | ||||
| Old Sales | Latest Sales | Gain/ Loss | % Increase | |
| 25-coin roll set (P) | 8,022 | 8,022 | – | – |
| 25-coin roll set (D) | 6,986 | 6,986 | – | – |
| 100-coin bag (P) | 2,845 | 2,891 | 46 | 1.62% |
| 100-coin bag (D) | 2,763 | 2,765 | 2 | 0.07% |
2023 American Innovation Dollars – Louisiana | ||||
| Old Sales | Latest Sales | Gain/ Loss | % Increase | |
| 25-coin roll set (P) | 7,989 | 7,989 | – | – |
| 25-coin roll set (D) | 6,985 | 6,985 | – | – |
| 100-coin bag (P) | 2,539 | 2,552 | 13 | 0.51% |
| 100-coin bag (D) | 2,457 | 2,475 | 18 | 0.73% |
2023 American Innovation Dollars – Ohio | ||||
| Old Sales | Latest Sales | Gain/ Loss | % Increase | |
| 25-coin roll set (P) | 8,015 | 8,015 | – | – |
| 25-coin roll set (D) | 6,973 | 6,973 | – | – |
| 100-coin bag (P) | 2,956 | 2,957 | 1 | 0.03% |
| 100-coin bag (D) | 2,734 | 2,735 | 1 | 0.04% |
2022 American Innovation Dollars – Tennessee | ||||
| Old Sales | Latest Sales | Gain/ Loss | % Increase | |
| 25-coin roll set (P) | 7,013 | 7,013 | – | – |
| 25-coin roll set (D) | 7,007 | 7,007 | – | – |
| 100-coin bag (P) | 2,770 | 2,770 | – | – |
| 100-coin bag (D) | 2,771 | 2,771 | – | – |
2022 American Innovation Dollars – Kentucky | ||||
| Old Sales | Latest Sales | Gain/ Loss | % Increase | |
| 25-coin roll set (P) | 7,004 | 7,004 | – | – |
| 25-coin roll set (D) | 6,993 | 6,993 | – | – |
| 100-coin bag (P) | 2,768 | 2,768 | – | – |
| 100-coin bag (D) | 2,778 | 2,778 | – | – |
2022 American Innovation Dollars – Vermont | ||||
| Old Sales | Latest Sales | Gain/ Loss | % Increase | |
| 25-coin roll set (P) | 7,023 | 7,023 | – | – |
| 25-coin roll set (D) | 7,011 | 7,011 | – | – |
| 100-coin bag (P) | 2,787 | 2,787 | – | – |
| 100-coin bag (D) | 2,776 | 2,776 | – | – |
2022 American Innovation Dollars – Rhode Island | ||||
| Old Sales | Latest Sales | Gain/ Loss | % Increase | |
| 25-coin roll set (P) | 7,010 | 7,010 | – | – |
| 25-coin roll set (D) | 7,007 | 7,007 | – | – |
| 100-coin bag (P) | 2,789 | 2,789 | – | – |
| 100-coin bag (D) | 2,786 | 2,786 | – | – |
2021 American Innovation Dollars – North Carolina | ||||
| Old Sales | Latest Sales | Gain/ Loss | % Increase | |
| 25-coin roll set (P) | 7,010 | 7,010 | – | – |
| 25-coin roll set (D) | 7,018 | 7,018 | – | – |
| 100-coin bag (P) | 2,789 | 2,789 | – | – |
| 100-coin bag (D) | 2,790 | 2,790 | – | – |
2021 American Innovation Dollars – New York | ||||
| Old Sales | Latest Sales | Gain/ Loss | % Increase | |
| 25-coin roll set (P) | 7,006 | 7,006 | – | – |
| 25-coin roll set (D) | 7,013 | 7,013 | – | – |
| 100-coin bag (P) | 2,786 | 2,786 | – | – |
| 100-coin bag (D) | 2,785 | 2,785 | – | – |
2021 American Innovation Dollars – Virginia | ||||
| Old Sales | Latest Sales | Gain/ Loss | % Increase | |
| 25-coin roll set (P) | 7,015 | 7,015 | – | – |
| 25-coin roll set (D) | 7,010 | 7,010 | – | – |
| 100-coin bag (P) | 2,796 | 2,796 | – | – |
| 100-coin bag (D) | 2,786 | 2,786 | – | – |
2021 American Innovation Dollars – New Hampshire | ||||
| Old Sales | Latest Sales | Gain/ Loss | % Increase | |
| 25-coin roll set (P) | 7,017 | 7,017 | – | – |
| 25-coin roll set (D) | 7,018 | 7,018 | – | – |
| 100-coin bag (P) | 2,789 | 2,789 | – | – |
| 100-coin bag (D) | 2,790 | 2,790 | – | – |
2020 American Innovation Dollars – South Carolina | ||||
| Old Sales | Latest Sales | Gain/ Loss | % Increase | |
| Reverse Proof (S) | 41,133 | 41,164 | 31 | 0.08% |
| 25-coin roll set (P) | 6,378 | 6,378 | – | – |
| 25-coin roll set (D) | 6,399 | 6,399 | – | – |
| 100-coin bag (P) | 2,734 | 2,734 | – | – |
| 100-coin bag (D) | 2,378 | 2,378 | – | – |
2020 American Innovation Dollars – Maryland | ||||
| Old Sales | Latest Sales | Gain/ Loss | % Increase | |
| Reverse Proof (S) | 49,735 | 49,735 | – | – |
| 25-coin roll set (P) | 6,493 | 6,493 | – | – |
| 25-coin roll set (D) | 6,471 | 6,471 | – | – |
| 100-coin bag (P) | 2,725 | 2,725 | – | – |
| 100-coin bag (D) | 2,737 | 2,737 | – | – |
2020 American Innovation Dollars – Massachusetts | ||||
| Old Sales | Latest Sales | Gain/ Loss | % Increase | |
| Reverse Proof (S) | 48,649 | 48,696 | 47 | 0.10% |
| 25-coin roll set (P) | 6,486 | 6,486 | – | – |
| 25-coin roll set (D) | 6,481 | 6,481 | – | – |
| 100-coin bag (P) | 2,746 | 2,746 | – | – |
| 100-coin bag (D) | 2,744 | 2,744 | – | – |
2020 American Innovation Dollars – Connecticut | ||||
| Old Sales | Latest Sales | Gain/ Loss | % Increase | |
| Reverse Proof (S) | 46,597 | 46,621 | 24 | 0.05% |
| 25-coin roll set (P) | 6,496 | 6,496 | – | – |
| 25-coin roll set (D) | 6,425 | 6,425 | – | – |
| 100-coin bag (P) | 2,736 | 2,736 | – | – |
| 100-coin bag (D) | 2,747 | 2,747 | – | – |
2019 American Innovation Dollars – Georgia | ||||
| Old Sales | Latest Sales | Gain/ Loss | % Increase | |
| Reverse Proof (S) | 46,969 | 46,999 | 30 | 0.06% |
| 25-coin roll set (P) | 7,967 | 7,977 | 10 | 0.13% |
| 25-coin roll set (D) | 7,417 | 7,427 | 10 | 0.13% |
| 100-coin bag (P) | 3,404 | 3,408 | 4 | 0.12% |
| 100-coin bag (D) | 3,279 | 3,282 | 3 | 0.09% |
2019 American Innovation Dollars – New Jersey | ||||
| Old Sales | Latest Sales | Gain/ Loss | % Increase | |
| Reverse Proof (S) | 50,386 | 50,408 | 22 | 0.04% |
| 25-coin roll set (P) | 8,901 | 8,911 | 10 | 0.11% |
| 25-coin roll set (D) | 7,918 | 7,927 | 9 | 0.11% |
| 100-coin bag (P) | 3,889 | 3,894 | 5 | 0.13% |
| 100-coin bag (D) | 3,517 | 3,527 | 10 | 0.28% |
2019 American Innovation Dollars – Pennsylvania | ||||
| Old Sales | Latest Sales | Gain/ Loss | % Increase | |
| Reverse Proof (S) | 54,879 | 54,902 | 23 | 0.04% |
| 25-coin roll set (P) | 10,214 | 10,231 | 17 | 0.17% |
| 25-coin roll set (D) | 8,391 | 8,399 | 8 | 0.10% |
| 100-coin bag (P) | 3,573 | 3,581 | 8 | 0.22% |
| 100-coin bag (D) | 2,985 | 2,993 | 8 | 0.27% |
2019 American Innovation Dollars – Delaware | ||||
| Old Sales | Latest Sales | Gain/ Loss | % Increase | |
| Reverse Proof (S) | 70,410 | 70,430 | 20 | 0.03% |
| 25-coin roll set (P) | 8,993 | 9,002 | 9 | 0.10% |
| 25-coin roll set (D) | 8,280 | 8,286 | 6 | 0.07% |
| 100-coin bag (P) | 3,172 | 3,178 | 6 | 0.19% |
| 100-coin bag (D) | 3,339 | 3,342 | 3 | 0.09% |
2018 American Innovation Dollars | ||||
| Old Sales | Latest Sales | Gain/ Loss | % Increase | |
| Reverse Proof (S)* | 74,720 | 74,720 | – | – |
| Proof Coin (S) | 253,045 | 253,145 | 100 | 0.04% |
| 25-coin roll set (P) | 22,550 | 22,581 | 31 | 0.14% |
| 25-coin roll set (D) | 25,414 | 25,450 | 36 | 0.14% |
| 100-coin bag (P)* | 2,935 | 2,935 | – | – |
| 100-coin bag (D)* | 2,954 | 2,954 | – | – |
George H.W. Bush Coin & Chronicles Set | ||||
| Old Sales | Latest Sales | Gain/ Loss | % Increase | |
| $1 Coin & Set | 11,329 | 11,343 | 14 | 0.12% |
2020 Bush Presidential $1 Coin & First Spouse Medal Set | ||||
| Old Sales | Latest Sales | Gain/ Loss | % Increase | |
| $1 Coin & Set | 9,876 | 9,876 | – | – |
2020 George H.W. Bush Presidential $1 Coins | ||||
| Old Sales | Latest Sales | Gain/ Loss | % Increase | |
| 25-coin roll (P) | 24,911 | 24,912 | 1 | 0.00% |
| 25-coin roll (D) | 22,381 | 22,457 | 76 | 0.34% |
| 100-coin bag (P) | 2,695 | 2,695 | – | – |
| 100-coin bag (D) | 2,098 | 2,098 | – | – |
| 250-coin bag (P) | 2,856 | 2,864 | 8 | 0.28% |
| 250-coin bag (D) | 4,347 | 4,367 | 20 | 0.46% |
Native American Dollar Rolls | ||||
| Old Sales | Latest Sales | Gain/ Loss | % Increase | |
| 2023-P Native American $1 25 Coin Roll | 13,888 | 13,913 | 25 | 0.18% |
| 2023-D Native American $1 25 Coin Roll | 13,086 | 13,224 | 138 | 1.05% |
| 2023-P Native American $1 100-Coin Bag | 1,690 | 1,690 | – | – |
| 2023-D Native American $1 100-Coin Bag | 1,694 | 1,694 | – | – |
| 2023-P Native American $1 250-Coin Box | 1,269 | 1,286 | 17 | 1.34% |
| 2023-D Native American $1 250-Coin Box | 1,399 | 1,418 | 19 | 1.36% |
| 2022-P Native American $1 25 Coin Roll | 13,996 | 13,996 | – | – |
| 2022-D Native American $1 25 Coin Roll | 13,959 | 13,959 | – | – |
| 2022-P Native American $1 100-Coin Bag | 1,699 | 1,699 | – | – |
| 2022-D Native American $1 100-Coin Bag | 1,614 | 1,614 | – | – |
| 2022-P Native American $1 250-Coin Box | 1,698 | 1,698 | – | – |
| 2022-D Native American $1 250-Coin Box | 1,699 | 1,699 | – | – |
Kennedy Half Dollar Rolls | ||||
| Old Sales | Latest Sales | Gain/ Loss | % Increase | |
| 2023-dated 200-coin bag (P&D) | 10,404 | 10,502 | 98 | 0.94% |
| 2023-dated 2-roll set (P&D) | 24,973 | 24,973 | – | – |
| 2022-dated 200-coin bag (P&D) | 10,999 | 10,999 | – | – |
| 2022-dated 2-roll set (P&D) | 21,926 | 21,926 | – | – |
| 2021-dated 200-coin bag (P&D)* | 9,976 | 9,976 | – | – |
| 2021-dated 2-roll set (P&D)* | 21,989 | 21,989 | – | – |
| 2020-dated 200-coin bag (P&D)* | 11,776 | 11,776 | – | – |
| 2020-dated 2-roll set (P&D)* | 24,312 | 24,312 | – | – |
| 2019-dated 200-coin bag (P&D)* | 11,534 | 11,534 | – | – |
| 2019-dated 2-roll set (P&D)* | 24,132 | 24,132 | – | – |
2023 Maria Tallchief Quarters | ||||
| Old Sales | Latest Sales | Gain/ Loss | % Increase | |
| Three-Roll Set | 11,904 | 11,945 | 41 | 0.34% |
| 100-Coin Bag (P) | 1,672 | 1,682 | 10 | 0.60% |
| 100-Coin Bag (D) | 1,536 | 1,540 | 4 | 0.26% |
| Two-Roll Set | 3,148 | 3,168 | 20 | 0.64% |
2023 Jovita Idar Quarters | ||||
| Old Sales | Latest Sales | Gain/ Loss | % Increase | |
| Three-Roll Set | 12,551 | 12,558 | 7 | 0.06% |
| 100-Coin Bag (P) | 3,718 | 3,728 | 10 | 0.27% |
| 100-Coin Bag (D) | 3,420 | 3,429 | 9 | 0.26% |
| Two-Roll Set | 3,446 | 3,464 | 18 | 0.52% |
2023 Eleanor Roosevelt Quarters | ||||
| Old Sales | Latest Sales | Gain/ Loss | % Increase | |
| Three-Roll Set | 12,678 | 12,678 | – | – |
| 100-Coin Bag (P) | 4,163 | 4,167 | 4 | 0.10% |
| 100-Coin Bag (D) | 3,878 | 3,878 | – | – |
| Two-Roll Set | 4,256 | 4,262 | 6 | 0.14% |
2023 Edith Kanakaʻole Quarters | ||||
| Old Sales | Latest Sales | Gain/ Loss | % Increase | |
| Three-Roll Set | 12,578 | 12,582 | 4 | 0.03% |
| 100-Coin Bag (P) | 7,015 | 7,023 | 8 | 0.11% |
| 100-Coin Bag (D) | 4,421 | 4,424 | 3 | 0.07% |
| Two-Roll Set | 5,474 | 5,490 | 16 | 0.29% |
2023 Bessie Coleman Quarters | ||||
| Old Sales | Latest Sales | Gain/ Loss | % Increase | |
| Three-Roll Set | 12,509 | 12,509 | – | – |
| 100-Coin Bag (P) | 5,393 | 5,406 | 13 | 0.24% |
| 100-Coin Bag (D) | 4,796 | 4,799 | 3 | 0.06% |
| Two-Roll Set | 5,622 | 5,634 | 12 | 0.21% |
2022 Anna May Wong Quarters | ||||
| Old Sales | Latest Sales | Gain/ Loss | % Increase | |
| Three-Roll Set | 7,617 | 7,617 | – | – |
| 100-Coin Bag (P) | 1,860 | 1,860 | – | – |
| 100-Coin Bag (D) | 1,858 | 1,858 | – | – |
| Two-Roll Set | 5,936 | 5,936 | – | – |
2022 Nina Otero-Warren Quarters | ||||
| Old Sales | Latest Sales | Gain/ Loss | % Increase | |
| Three-Roll Set | 7,639 | 7,639 | – | – |
| 100-Coin Bag (P) | 1,853 | 1,853 | – | – |
| 100-Coin Bag (D) | 1,855 | 1,855 | – | – |
| Two-Roll Set | 5,883 | 5,883 | – | – |
2022 Wilma Mankiller Quarters | ||||
| Old Sales | Latest Sales | Gain/ Loss | % Increase | |
| Three-Roll Set | 7,616 | 7,616 | – | – |
| 100-Coin Bag (P) | 1,850 | 1,850 | – | – |
| 100-Coin Bag (D) | 1,822 | 1,822 | – | – |
| Two-Roll Set | 5,912 | 5,912 | – | – |
2022 Dr. Sally Ride Quarters | ||||
| Old Sales | Latest Sales | Gain/ Loss | % Increase | |
| Three-Roll Set | 7,603 | 7,603 | – | – |
| 100-Coin Bag (P) | 1,854 | 1,854 | – | – |
| 100-Coin Bag (D) | 1,852 | 1,852 | – | – |
| Two-Roll Set | 5,926 | 5,926 | – | – |
2022 Maya Angelou Quarters | ||||
| Old Sales | Latest Sales | Gain/ Loss | % Increase | |
| Three-Roll Set | 7,588 | 7,588 | – | – |
| 100-Coin Bag (P) | 1,858 | 1,858 | – | – |
| 100-Coin Bag (D) | 1,861 | 1,861 | – | – |
| Two-Roll Set | 5,940 | 5,940 | – | – |


