New Native American $1 Coins logged solid early sales, the latest batch of U.S. Mint figures show, although their levels declined a bit from the debut performance of last year’s dollar.
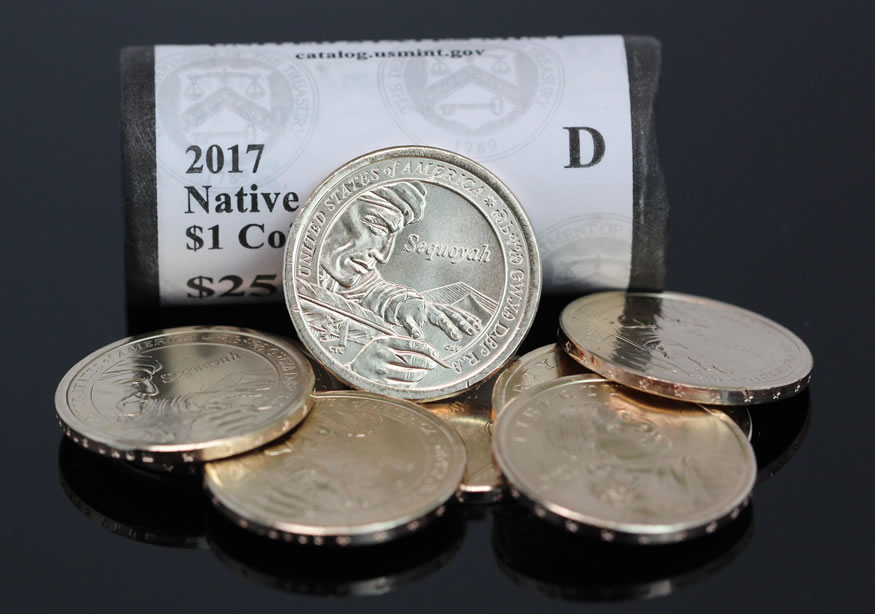
The series features annually changing designs with the latest coin commemorating Sequoyah, a silversmith and creator of the Cherokee language.
Collectors ordered a combined 999,975 coins through roll, bag and box options, registering a 1.8% decrease from the opening of last year’s issue. Here’s a table that illustrates how starting sales of the series has varied since its introduction in 2009:
Debut Sales of 2009 – 2017 Native American $1 Coins
| Product | 2009 | 2010 | 2011 | 2012 | 2013 | 2014 | 2015 | 2016 | 2017 |
|---|---|---|---|---|---|---|---|---|---|
| 25-Coin Roll (P) | 22,539 | 8,333 | 9,655 | 9,748 | 9,775 | 8,455 | 9,010 | 9,184 | 8,959 |
| 25-Coin Roll (D) | 19,333 | 8,446 | 9,401 | 9,753 | 9,457 | 8,362 | 8,942 | 9,095 | 8,928 |
| 100-Coin Bags (P) | Not Issued | 292 | 391 | 406 | 426 | 532 | 476 | ||
| 100-Coin Bags (D) | 247 | 403 | 381 | 346 | 709 | 507 | |||
| 250-Coin Box (P) | 747 | 1,106 | 758 | 734 | 883 | 807 | |||
| 250-Coin Box (D) | 746 | 1,118 | 741 | 793 | 865 | 1,011 | |||
| 500-Coin Box (P) | 120 | 131 | Not Issued | ||||||
| 500-Coin Box (D) | 94 | 117 | |||||||
| Totals | 1,046,800 | 419,475 | 476,400 | 1,021,675 | 1,240,200 | 837,875 | 907,750 | 1,018,075 | 999,975 |
The new dollars were among the Mint’s best-selling products.
Weekly U.S. Mint Top Sellers
Here’s a showing of the Mint’s most popular products for the week ended Jan. 29:
- 2017-P Native American $1 Coin Roll (+8,959)
- 2017-D Native American $1 Coin Roll (+8,928)
- 2017 Lion Clubs Proof Silver Dollar (+6,468 29,817)
- 2016-W Proof Silver Eagle (+1,975 532,862)
- 2017 Lion Clubs Uncirculated Silver Dollar (+1,855 8,962)
- 2017 America the Beautiful Quarters Proof Set (+1,832 41,798)
- 2016 Proof Set (+1,347 581,356)
- 2016 Silver Proof Set (+1,020 361,630)
- 2017-D Native 250-Coin Box (+1,011)
- 2017-P Native 250-Coin Box (+807)
- 2016 Mint Set (+681 270,172)
- 2016 Proof Gold Eagle Four-Coin Set (+601 16,832)
- 2017 Birth Set (+545 4,134)
- 2017-D Native 100-Coin Bag (+507)
- 2017-P Native 100-Coin Bag (+476)
The U.S. Mint published sales data for 253 numismatic products. Eighty-nine of them outperformed their prior weekly gains compared to 96 previously. Six of them increased by more than 1,000 units compared to 4 previously.
Eleven products also saw their sales total reduced compared to 16 previously. As typical, most of them logged modest declines. The centennial 2016-W Walking Liberty Gold Coin saw a more aggressive adjustment, falling 479 to 60,331.
US Mint Sales: Numismatic Products
Below are tables showing the latest sales for U.S. Mint numismatic products. The sales period covers Jan. 23 to 29. Products with an asterisk (*) are no longer available.
2016 Centennial Gold Coins |
||||
| Old Sales |
Latest Sales |
Gain/ Loss |
% Increase |
|
| Gold Walking Liberty Half-Dollar | 60,810 | 60,331 | -479 | -0.79% |
| Gold Standing Liberty Quarter | 87,443 | 87,554 | 111 | 0.13% |
| Gold Mercury Dime* | 124,884 | 124,883 | -1 | 0.00% |
2016 American Liberty Silver Medals |
||||
| Old Sales |
Latest Sales |
Gain/ Loss |
% Increase |
|
| San Francisco Mint* | 12,176 | 12,176 | – | – |
| West Point Mint* | 12,183 | 12,183 | – | – |
2016 NPS Commemorative Coins |
||||
| Old Sales |
Latest Sales |
Gain/ Loss |
% Increase |
|
| $5 Gold Proof | 4,917 | 4,916 | -1 | -0.02% |
| $5 Gold Uncirculated | 5,164 | 5,160 | -4 | -0.08% |
| $1 Silver Proof | 62,726 | 62,723 | -3 | 0.00% |
| $1 Silver Uncirculated | 20,997 | 20,996 | -1 | 0.00% |
| 50c Proof Clad Half-Dollar | 40,256 | 40,256 | – | – |
| 50c Uncirculated Clad Half-Dollar | 21,016 | 21,028 | 12 | 0.06% |
| Three-Coin Proof Set | 14,589 | 14,588 | -1 | -0.01% |
2016 Mark Twain Commemorative Coins |
||||
| Old Sales |
Latest Sales |
Gain/ Loss |
% Increase |
|
| $5 Gold Proof | 13,266 | 13,266 | – | – |
| $5 Gold Uncirculated | 5,693 | 5,693 | – | – |
| $1 Silver Proof | 78,536 | 78,536 | – | – |
| $1 Silver Uncirculated | 26,284 | 26,284 | – | – |
Clad Proof Sets |
||||
| Old Sales |
Latest Sales |
Gain/ Loss |
% Increase |
|
| 2016 Proof Set | 580,009 | 581,356 | 1,347 | 0.23% |
| 2015 Proof Sets* | 662,876 | 662,875 | -1 | 0.00% |
| 2014 Proof Sets* | 714,661 | 714,661 | – | – |
| 2013 Proof Sets* | 802,460 | 802,460 | – | – |
| 2016 America the Beautiful Quarters Proof Sets | 39,966 | 41,798 | 1,832 | 4.58% |
| 2016 America the Beautiful Quarters Proof Sets | 85,873 | 86,025 | 152 | 0.18% |
| 2015 America the Beautiful Quarters Proof Sets | 99,477 | 99,477 | – | – |
| 2014 America the Beautiful Quarters Proof Sets* | 115,179 | 115,179 | – | – |
| 2013 America the Beautiful Quarters Proof Sets* | 128,377 | 128,377 | – | – |
| 2016 Ronald Reagan Coin & Chronicles Set | 40,511 | 40,613 | 102 | 0.25% |
| 2015 Lyndon B. Johnson Coin & Chronicles Set* | 23,905 | 23,905 | – | – |
| 2015 John F. Kennedy Coin & Chronicles Set* | 49,051 | 49,051 | – | – |
| 2015 Eisenhower Coin & Chronicles Set* | 16,744 | 16,744 | – | – |
| 2015 Truman Coin & Chronicles Set* | 16,812 | 16,812 | – | – |
| 2014 Franklin D. Roosevelt Coin & Chronicles Set* | 19,050 | 19,050 | – | – |
| 2013 Theodore Roosevelt Coin & Chronicles Set* | 15,145 | 15,145 | – | – |
| 2016 Presidential $1 Coin Proof Sets | 214,063 | 214,235 | 172 | 0.08% |
| 2015 Presidential $1 Coin Proof Sets* | 222,068 | 222,068 | – | – |
| 2014 Presidential $1 Coin Proof Sets* | 229,415 | 229,415 | – | – |
| 2013 Presidential $1 Coin Proof Sets* | 266,618 | 266,618 | – | – |
| 2017 Happy Birthday Gift Sets | 3,314 | 3,760 | 446 | 13.46% |
| 2016 Happy Birthday Gift Sets | 16,066 | 16,152 | 86 | 0.54% |
| 2015 Happy Birthday Gift Sets* | 14,470 | 14,470 | – | – |
| 2014 Happy Birthday Gift Sets | 13,199 | 13,210 | 11 | 0.08% |
| 2013 Happy Birthday Gift Sets | 11,748 | 11,755 | 7 | 0.06% |
| 2017 Birth Gift Sets | 3,589 | 4,134 | 545 | 15.19% |
| 2016 Birth Gift Sets | 29,707 | 29,707 | – | – |
| 2015 Birth Gift Sets* | 34,548 | 34,548 | – | – |
| 2014 Birth Gift Sets | 35,030 | 35,046 | 16 | 0.05% |
| 2013 Birth Gift Sets | 41,851 | 41,854 | 3 | 0.01% |
| 2012 Birth Gift Sets* | 49,703 | 49,703 | – | – |
Silver Proof Sets |
||||
| Old Sales |
Latest Sales |
Gain/ Loss |
% Increase |
|
| 2016 Silver Proof Sets | 360,610 | 361,630 | 1,020 | 0.28% |
| 2015 Silver Proof Sets* | 387,321 | 387,322 | 1 | 0.00% |
| 2014 Silver Proof Sets* | 429,493 | 429,493 | – | – |
| 2016 America the Beautiful Quarters Silver Proof Sets | 89,334 | 89,580 | 246 | 0.28% |
| 2015 America the Beautiful Quarters Silver Proof Sets | 103,367 | 103,366 | -1 | 0.00% |
| 2014 America the Beautiful Quarters Silver Proof Sets* | 119,251 | 119,251 | – | – |
| 2013 America the Beautiful Quarters Silver Proof Sets* | 138,451 | 138,451 | – | – |
| 2016 Congratulations Gift Sets | 2,209 | 2,228 | 19 | 0.86% |
| 2015 Congratulations Gift Sets* | 7,895 | 7,895 | – | – |
| 2014 Congratulations Gift Sets* | 7,529 | 7,529 | – | – |
| 2013 Congratulations Gift Sets* | 18,347 | 18,347 | – | – |
| 2016 Limited Edition Silver Proof Sets | 36,183 | 36,543 | 360 | 0.99% |
| 2014 Limited Edition Silver Proof Sets* | 42,614 | 42,614 | – | – |
US Mint Uncirculated Sets |
||||
| Old Sales |
Latest Sales |
Gain/ Loss |
% Increase |
|
| 2016 American $1 Coin and Currency Set | 46,537 | 46,659 | 122 | 0.26% |
| 2015 American $1 Coin and Currency Set* | 88,805 | 88,805 | – | – |
| 2014 American $1 Coin and Currency Set* | 50,000 | 50,000 | – | – |
| 2016 Uncirculated Mint Sets | 269,491 | 270,172 | 681 | 0.25% |
| 2015 Uncirculated Mint Sets* | 314,032 | 314,034 | 2 | 0.00% |
| 2014 Uncirculated Mint Sets* | 345,813 | 345,813 | – | – |
| 2013 Uncirculated Mint Sets* | 376,844 | 376,844 | – | – |
| 2016 Presidential $1 Coin Uncirculated Sets | 52,125 | 52,259 | 134 | 0.26% |
| 2015 Presidential $1 Coin Uncirculated Sets | 60,008 | 60,086 | 78 | 0.13% |
| 2014 Presidential $1 Coin Uncirculated Sets | 63,535 | 63,592 | 57 | 0.09% |
| 2013 Presidential $1 Coin Uncirculated Sets* | 75,846 | 75,846 | – | – |
| 2012 Presidential $1 Coin Uncirculated Sets* | 99,743 | 99,743 | – | – |
| 2011 Presidential $1 Coin Uncirculated Sets | 85,634 | 85,642 | 8 | 0.01% |
| 2016 Annual Uncirculated Dollar Coin Sets | 15,115 | 15,325 | 210 | 1.39% |
| 2015 Annual Uncirculated Dollar Coin Sets* | 22,691 | 22,691 | – | – |
| 2014 Annual Uncirculated Dollar Coin Sets* | 28,637 | 28,637 | – | – |
| 2013 Annual Uncirculated Dollar Coin Sets* | 43,150 | 43,150 | – | – |
| 2013 Theodore Roosevelt Presidential Discovery Sets | 10,214 | 10,217 | 3 | 0.03% |
Coin Discovery Set |
||||
| Old Sales |
Latest Sales |
Gain/ Loss |
% Increase |
|
| 2014 | 8,342 | 8,353 | 11 | 0.13% |
Proof Silver Eagles |
||||
| Old Sales |
Latest Sales |
Gain/ Loss |
% Increase |
|
| 2016-W Proof Silver Eagles | 530,887 | 532,862 | 1,975 | 0.37% |
| 2015-W Proof Silver Eagles* | 699,623 | 699,623 | – | – |
| 2014-W Proof Silver Eagles* | 894,614 | 894,614 | – | – |
| 2013-W Proof Silver Eagles* | 868,494 | 868,494 | – | – |
Uncirculated Silver Eagles |
||||
| Old Sales |
Latest Sales |
Gain/ Loss |
% Increase |
|
| 2016 | 167,753 | 167,807 | 54 | 0.03% |
| 2015* | 201,188 | 201,188 | – | – |
| 2014* | 224,532 | 224,532 | – | – |
| 2013* | 178,941 | 178,941 | – | – |
2016 Proof American Eagle Gold Coins |
||||
| Old Sales |
Latest Sales |
Gain/ Loss |
% Increase |
|
| 1 oz | 22,902 | 22,984 | 82 | 0.36% |
| 1/2 oz | 5,463 | 5,496 | 33 | 0.60% |
| 1/4 oz* | 7,135 | 7,135 | – | – |
| 1/10 oz* | 21,619 | 21,619 | – | – |
| 4-Coin Set | 16,231 | 16,832 | 601 | 3.70% |
2015 Proof American Eagle Gold Coins |
||||
| Old Sales |
Latest Sales |
Gain/ Loss |
% Increase |
|
| 1 oz* | 22,734 | 22,734 | – | – |
| 1/2 oz* | 5,903 | 5,902 | – | – |
| 1/4 oz* | 5,857 | 5,857 | – | – |
| 1/10 oz* | 16,851 | 16,851 | – | – |
| 4-Coin Set* | 9,918 | 9,918 | – | – |
Uncirculated American Eagle Gold Coins |
||||
| Old Sales |
Latest Sales |
Gain/ Loss |
% Increase |
|
| 2016* | 6,887 | 6,887 | – | – |
| 2015* | 6,531 | 6,533 | – | – |
| 2014* | 7,902 | 7,902 | – | – |
| 2013* | 7,293 | 7,293 | – | – |
Proof American Buffalo Gold Coins |
||||
| Old Sales |
Latest Sales |
Gain/ Loss |
% Increase |
|
| 2016 Proof Gold Buffalo* | 21,878 | 21,878 | – | – |
| 2015 Proof Gold Buffalo* | 16,591 | 16,591 | – | – |
| 2014 Proof Gold Buffalo* | 20,557 | 20,557 | – | – |
Proof American Platinum Eagle |
||||
| Old Sales |
Latest Sales |
Gain/ Loss |
% Increase |
|
| 2016* | 9,151 | 9,151 | – | – |
| 2015* | 3,881 | 3,881 | – | – |
| 2014* | 4,596 | 4,596 | – | – |
America the Beautiful 5 Oz Silver Coins |
||||
| Old Sales |
Latest Sales |
Gain/ Loss |
% Increase |
|
| 2016-P Fort Moultrie Silver Coins | 15,494 | 15,635 | 141 | 0.91% |
| 2016-P Theodore Roosevelt Silver Coins* | 18,917 | 18,917 | – | – |
| 2016-P Harpers Ferry Silver Coins | 18,898 | 18,896 | -2 | -0.01% |
| 2016-P Cumberland Gap Silver Coins* | 18,713 | 18,713 | – | – |
| 2016-P Shawnee Silver Coins* | 18,781 | 18,781 | – | – |
| 2015-P Saratoga Silver Coins* | 17,563 | 17,563 | – | – |
| 2015-P Bombay Hook Silver Coins* | 17,309 | 17,309 | – | – |
| 2015-P Blue Ridge Parkway Silver Coins* | 17,461 | 17,461 | – | – |
| 2015-P Kisatchie Silver Coins* | 19,449 | 19,449 | – | – |
| 2015-P Homestead Silver Coins* | 21,283 | 21,286 | – | – |
| 2014-P Everglades Silver Coins* | 22,732 | 22,732 | – | – |
| 2014-P Great Sand Dunes Silver Coins* | 24,103 | 24,103 | – | – |
| 2014-P Arches Silver Coins* | 28,434 | 28,434 | – | – |
| 2014-P Shenandoah Silver Coins* | 28,451 | 28,451 | – | – |
| 2014-P Great Smoky Mountains Silver Coins* | 24,710 | 24,710 | – | – |
| 2013-P White Mountain Silver Coins* | 20,530 | 20,530 | – | – |
| 2013-P Perry’s Victory Silver Coins* | 17,707 | 17,707 | – | – |
| 2013-P Great Basin Silver Coins* | 17,792 | 17,792 | – | – |
| 2013-P Fort McHenry Silver Coins* | 19,802 | 19,802 | – | – |
| 2013-P Mount Rushmore Silver Coins* | 23,547 | 23,547 | – | – |
First Spouse Gold Coins |
||||
| Old Sales |
Latest Sales |
Gain/ Loss |
% Increase |
|
| Nancy Reagan Proof (2016) | 3,327 | 3,337 | 10 | 0.30% |
| Nancy Reagan Uncirculated (2016) | 1,784 | 1,789 | 5 | 0.28% |
| Betty Ford Proof (2016) | 2,243 | 2,274 | 31 | 1.38% |
| Betty Ford Uncirculated (2016) | 1,507 | 1,533 | 26 | 1.73% |
| Pat Nixon Proof (2016) | 2,465 | 2,469 | 4 | 0.16% |
| Pat Nixon Uncirculated (2016) | 1,550 | 1,547 | -3 | -0.19% |
| Lady Bird Johnson Proof (2015) | 2,621 | 2,623 | 2 | 0.08% |
| Lady Bird Johnson Uncirculated (2015) | 1,739 | 1,740 | 1 | 0.06% |
| Jacqueline Kennedy Proof (2015)* | 11,222 | 11,222 | – | – |
| Jacqueline Kennedy Uncirculated (2015) | 6,503 | 6,512 | 9 | 0.14% |
| Mamie Eisenhower Proof (2015) | 2,704 | 2,704 | – | – |
| Mamie Eisenhower Uncirculated (2015) | 1,923 | 1,933 | 10 | 0.52% |
| Bess Truman Proof (2015) | 2,599 | 2,605 | 6 | 0.23% |
| Bess Truman Uncirculated (2015) | 1,825 | 1,828 | 3 | 0.16% |
| Eleanor Roosevelt Proof (2014)* | 2,377 | 2,377 | – | – |
| Eleanor Roosevelt Uncirculated (2014)* | 1,886 | 1,886 | – | – |
| Lou Hoover Proof (2014)* | 2,392 | 2,392 | – | – |
| Lou Hoover Uncirculated (2014)* | 1,936 | 1,936 | – | – |
| Grace Coolidge Proof (2014)* | 2,315 | 2,315 | – | – |
| Grace Coolidge Uncirculated (2014)* | 1,949 | 1,949 | – | – |
| Florence Harding Proof (2014)* | 2,372 | 2,372 | – | – |
| Florence Harding Uncirculated (2014)* | 1,944 | 1,944 | – | – |
| Edith Wilson Proof (2013)* | 2,464 | 2,464 | – | – |
| Edith Wilson Uncirculated (2013)* | 1,974 | 1,974 | – | – |
| Ellen Wilson Proof (2013)* | 2,511 | 2,511 | – | – |
| Ellen Wilson Uncirculated (2013)* | 1,980 | 1,980 | – | – |
| Helen Taft Proof (2013)* | 2,598 | 2,598 | – | – |
| Helen Taft Uncirculated (2013)* | 1,993 | 1,993 | – | – |
| Edith Roosevelt Proof (2013)* | 2,840 | 2,840 | – | – |
| Edith Roosevelt Uncirculated (2013)* | 2,027 | 2,027 | – | – |
| Ida McKinley Proof (2013)* | 2,724 | 2,724 | – | – |
| Ida McKinley Uncirculated (2013)* | 2,008 | 2,008 | – | – |
| Alice Paul Proof (2012)* | 3,505 | 3,505 | – | – |
| Alice Paul Uncirculated (2012)* | 2,798 | 2,798 | – | – |
| Frances Cleveland Proof (2012, 1st Term)* | 3,158 | 3,158 | – | – |
| Frances Cleveland Uncirculated (2012 1st Term)* | 2,454 | 2,454 | – | – |
| Caroline Harrison Proof (2012)* | 3,046 | 3,046 | – | – |
| Caroline Harrison Uncirculated (2012)* | 2,436 | 2,436 | – | – |
| Frances Cleveland Proof (2012, 2nd Term)* | 3,104 | 3,104 | – | – |
| Frances Cleveland Uncirculated (2012 2nd Term)* | 2,425 | 2,425 | – | – |
Presidential $1 Coin Sets |
||||
| Old Sales |
Latest Sales |
Gain/ Loss |
% Increase |
|
| 2016-P | 9,067 | 9,136 | 69 | 0.76% |
| 2016-D | 7,026 | 7,026 | – | – |
| 2015-P | 12,173 | 12,197 | 24 | 0.20% |
| 2015-D | 10,375 | 10,392 | 17 | 0.16% |
| 2014-P | 13,351 | 13,358 | 7 | 0.05% |
| 2014-D | 9,938 | 9,947 | 9 | 0.09% |
| 2013-P* | 17,771 | 17,771 | – | – |
| 2013-D | 14,923 | 14,923 | – | – |
Presidential Coins & First Spouse Medal Sets |
||||
| Old Sales |
Latest Sales |
Gain/ Loss |
% Increase |
|
| Reagan | 12,405 | 12,436 | 31 | 0.25% |
| Ford | 6,057 | 6,073 | 16 | 0.26% |
| Nixon | 7,124 | 7,137 | 13 | 0.18% |
| Johnson | 7,431 | 7,440 | 9 | 0.12% |
| Kennedy* | 24,183 | 24,183 | – | – |
| Eisenhower | 9,411 | 9,419 | 8 | 0.09% |
| Truman | 8,096 | 8,103 | 7 | 0.09% |
| Roosevelt* | 7,000 | 7,000 | – | – |
| Hoover* | 4,500 | 4,500 | – | – |
| Coolidge* | 4,500 | 4,500 | – | – |
| Harding* | 4,500 | 4,500 | – | – |
| Edith Wilson | 3,979 | 3,979 | – | – |
| Ellen Wilson | 3,998 | 3,998 | – | – |
| Helen Taft | 3,994 | 3,994 | – | – |
| Edith Roosevelt | 5,002 | 5,002 | – | – |
| Ida McKinley | 3,994 | 3,994 | – | – |
| Abigail Fillmore | 11,138 | 11,138 | – | – |
| Jane Pierce | 8,902 | 8,902 | – | – |
| Buchanan’s Liberty | 8,931 | 8,931 | – | – |
| Mary Todd Lincoln* | 15,858 | 15,858 | – | – |
| Eliza Johnson | 7,243 | 7,244 | 1 | 0.01% |
| Julia Grant | 7,981 | 7,981 | – | – |
| Lucy Hayes | 6,283 | 6,284 | 1 | 0.02% |
| Lucretia Garfield | 6,054 | 6,056 | 2 | 0.03% |
| Alice Paul | 6,001 | 6,004 | 3 | 0.05% |
| Frances Cleveland (1st) | 5,469 | 5,473 | 4 | 0.07% |
| Caroline Harrison | 5,376 | 5,378 | 2 | 0.04% |
| Frances Cleveland (2nd) | 5,245 | 5,248 | 3 | 0.06% |
Presidential $1 Coin Covers |
||||
| Old Sales |
Latest Sales |
Gain/ Loss |
% Increase |
|
| Ronald Reagan | 17,975 | 18,012 | 37 | 0.21% |
| Gerald R. Ford | 12,143 | 12,152 | 9 | 0.07% |
| Richard M. Nixon | 13,770 | 13,778 | 8 | 0.06% |
| Lyndon B. Johnson | 13,207 | 13,224 | 17 | 0.13% |
| John F. Kennedy | 22,675 | 22,696 | 21 | 0.09% |
| Dwight D. Eisenhower* | 14,823 | 14,823 | – | – |
| Harry S. Truman | 14,788 | 14,788 | – | – |
| Franklin Roosevelt | 14,858 | 14,862 | 4 | 0.03% |
| Herbert Hoover | 12,374 | 12,387 | 13 | 0.11% |
| Calvin Coolidge | 12,892 | 12,895 | 3 | 0.02% |
| Warren G. Harding | 13,051 | 13,054 | 3 | 0.02% |
| William Henry Harrison | 30,837 | 30,837 | – | – |
| John Tyler | 27,470 | 27,470 | – | – |
| James K. Polk | 25,703 | 25,703 | – | – |
| Zachary Taylor | 24,669 | 24,669 | – | – |
| Millard Fillmore | 23,822 | 23,821 | -1 | 0.00% |
| Franklin Pierce | 22,266 | 22,266 | – | – |
| James Buchanan | 21,001 | 21,000 | -1 | 0.00% |
| Abraham Lincoln* | 36,783 | 36,783 | – | – |
| Andrew Johnson | 19,468 | 19,468 | – | – |
| Ulysses S. Grant | 20,212 | 20,214 | 2 | 0.01% |
| Rutherford B. Hayes | 17,689 | 17,689 | – | – |
| James Garfield | 16,841 | 16,841 | – | – |
| Chester Arthur | 17,048 | 17,049 | 1 | 0.01% |
| Grover Cleveland (1st) | 15,482 | 15,482 | – | – |
| Benjamin Harrison | 15,130 | 15,133 | 3 | 0.02% |
| Grover Cleveland (2nd) | 14,398 | 14,399 | 1 | 0.01% |
| William McKinley | 14,726 | 14,733 | 7 | 0.05% |
| Theodore Roosevelt | 17,250 | 17,263 | 13 | 0.08% |
| William Howard Taft | 13,634 | 13,642 | 8 | 0.06% |
| Woodrow Wilson | 13,252 | 13,261 | 9 | 0.07% |
2016 Ronald Reagan $1 Coin Rolls, Bags, Boxes |
||||
| Old Sales |
Latest Sales |
Gain/ Loss |
% Increase |
|
| 25-coin roll set (P) | 43,959 | 44,053 | 94 | 0.21% |
| 25-coin roll set (D) | 39,997 | 40,075 | 78 | 0.20% |
| 100-coin bag (P) | 1,899 | 1,914 | 15 | 0.79% |
| 100-coin bag (D) | 1,759 | 1,771 | 12 | 0.68% |
| 250-coin box (P) | 6,727 | 6,759 | 32 | 0.48% |
| 250-coin box (D) | 6,109 | 6,170 | 61 | 1.00% |
2016 Gerald R. Ford $1 Coin Rolls, Bags, Boxes |
||||
| Old Sales |
Latest Sales |
Gain/ Loss |
% Increase |
|
| 25-coin roll set (P) | 42,824 | 42,867 | 43 | 0.10% |
| 25-coin roll set (D) | 38,464 | 38,492 | 28 | 0.07% |
| 100-coin bag (P) | 2,561 | 2,566 | 5 | 0.20% |
| 100-coin bag (D) | 1,069 | 1,075 | 6 | 0.56% |
| 250-coin box (P) | 4,674 | 4,684 | 10 | 0.21% |
| 250-coin box (D) | 4,552 | 4,558 | 6 | 0.13% |
2016 Richard M. Nixon $1 Coin Rolls, Bags, Boxes |
||||
| Old Sales |
Latest Sales |
Gain/ Loss |
% Increase |
|
| 25-coin roll set (P) | 44,641 | 44,676 | 35 | 0.08% |
| 25-coin roll set (D) | 38,905 | 38,933 | 28 | 0.07% |
| 100-coin bag (P) | 2,650 | 2,659 | 9 | 0.34% |
| 100-coin bag (D) | 1,224 | 1,230 | 6 | 0.49% |
| 250-coin box (P) | 5,014 | 5,022 | 8 | 0.16% |
| 250-coin box (D) | 4,916 | 4,920 | 4 | 0.08% |
2015 Lyndon B. Johnson $1 Coin Rolls, Bags, Boxes |
||||
| Old Sales |
Latest Sales |
Gain/ Loss |
% Increase |
|
| 25-coin roll set (P)* | 40,000 | 40,000 | – | – |
| 25-coin roll set (D)* | 37,742 | 37,742 | – | – |
| 100-coin bag (P) | 1,622 | 1,626 | 4 | 0.25% |
| 100-coin bag (D) | 1,553 | 1,554 | 1 | 0.06% |
| 250-coin box (P) | 4,688 | 4,688 | – | – |
| 250-coin box (D) | 6,063 | 6,069 | 6 | 0.10% |
2015 John F. Kennedy $1 Coin Rolls, Bags, Boxes |
||||
| Old Sales |
Latest Sales |
Gain/ Loss |
% Increase |
|
| 25-coin roll set (P) | 51,894 | 51,926 | 32 | 0.06% |
| 25-coin roll set (D) | 46,737 | 46,769 | 32 | 0.07% |
| 100-coin bag (P) | 2,494 | 2,503 | 9 | 0.36% |
| 100-coin bag (D) | 2,378 | 2,380 | 2 | 0.08% |
| 250-coin box (P) | 7,588 | 7,596 | 8 | 0.11% |
| 250-coin box (D) | 6,969 | 6,976 | 7 | 0.10% |
2015 Dwight D. Eisenhower $1 Coin Rolls, Bags, Boxes |
||||
| Old Sales |
Latest Sales |
Gain/ Loss |
% Increase |
|
| 25-coin roll set (P)* | 39,729 | 39,729 | – | – |
| 25-coin roll set (D)* | 37,728 | 37,728 | – | – |
| 100-coin bag (P) | 2,341 | 2,346 | 5 | 0.21% |
| 100-coin bag (D) | 2,245 | 2,248 | 3 | 0.13% |
| 250-coin box (P) | 7,764 | 7,770 | 6 | 0.08% |
| 250-coin box (D) | 6,071 | 6,076 | 5 | 0.08% |
2015 Harry S. Truman $1 Coin Rolls, Bags, Boxes |
||||
| Old Sales |
Latest Sales |
Gain/ Loss |
% Increase |
|
| 25-coin roll set (P)* | 39,686 | 39,686 | – | – |
| 25-coin roll set (D)* | 37,655 | 37,655 | – | – |
| 100-coin bag (P)* | 3,491 | 3,491 | – | – |
| 100-coin bag (D)* | 3,334 | 3,334 | – | – |
| 250-coin box (P) | 8,093 | 8,099 | 6 | 0.07% |
| 250-coin box (D) | 6,281 | 6,284 | 3 | 0.05% |
2014 Franklin Roosevelt $1 Coin Rolls, Bags, Boxes |
||||
| Old Sales |
Latest Sales |
Gain/ Loss |
% Increase |
|
| 25-coin roll set (P) | 58,303 | 58,334 | 31 | 0.05% |
| 25-coin roll set (D) | 52,949 | 52,976 | 27 | 0.05% |
| 100-coin bag (P)* | 1,986 | 1,986 | – | – |
| 100-coin bag (D)* | 1,968 | 1,968 | – | – |
| 250-coin box (P)* | 6,977 | 6,977 | – | – |
| 250-coin box (D)* | 5,025 | 5,025 | – | – |
2014 Herbert Hoover $1 Coin Rolls, Bags, Boxes |
||||
| Old Sales |
Latest Sales |
Gain/ Loss |
% Increase |
|
| 25-coin roll set (P) | 52,750 | 52,783 | 33 | 0.06% |
| 25-coin roll set (D) | 45,827 | 45,853 | 26 | 0.06% |
| 100-coin bag (P)* | 1,978 | 1,978 | – | – |
| 100-coin bag (D)* | 1,990 | 1,990 | – | – |
| 250-coin box (P) | 6,994 | 6,994 | – | – |
| 250-coin box (D)* | 5,050 | 5,050 | – | – |
Native American Dollar Rolls |
||||
| Old Sales |
Latest Sales |
Gain/ Loss |
% Increase |
|
| 2017-dated 25-coin roll set (P) | – | 8,959 | – | – |
| 2017-dated 25-coin roll set (D) | – | 8,928 | – | – |
| 2017-dated 100-coin bag (P) | – | 476 | – | – |
| 2017-dated 100-coin bag (D) | – | 507 | – | – |
| 2017-dated 250-coin box (P) | – | 807 | – | – |
| 2017-dated 250-coin box (D) | – | 1,011 | – | – |
| 2016-dated 25-coin roll set (P) | 16,755 | 16,842 | 87 | 0.52% |
| 2016-dated 25-coin roll set (D) | 16,397 | 16,477 | 80 | 0.49% |
| 2016-dated 100-coin bag (P) | 1,516 | 1,544 | 28 | 1.85% |
| 2016-dated 100-coin bag (D) | 1,529 | 1,541 | 12 | 0.78% |
| 2016-dated 250-coin box (P) | 1,677 | 1,688 | 11 | 0.66% |
| 2016-dated 250-coin box (D) | 1,781 | 1,792 | 11 | 0.62% |
| 2015-dated 25-coin roll set (P) | 18,441 | 18,471 | 30 | 0.16% |
| 2015-dated 25-coin roll set (D) | 18,729 | 18,754 | 25 | 0.13% |
| 2015-dated 100-coin bag (P) | 2,415 | 2,415 | – | – |
| 2015-dated 100-coin bag (D) | 2,454 | 2,454 | – | – |
| 2015-dated 250-coin box (P) | 2,218 | 2,227 | 9 | 0.41% |
| 2015-dated 250-coin box (D) | 2,161 | 2,175 | 14 | 0.65% |
Kennedy Half Dollar Rolls |
||||
| Old Sales |
Latest Sales |
Gain/ Loss |
% Increase |
|
| 2016-dated 200-coin bag (P&D) | 9,291 | 9,678 | 387 | 4.17% |
| 2016-dated 2-roll set (P&D) | 21,179 | 21,269 | 90 | 0.42% |
| 2015-dated 200-coin bag (P&D) | 13,504 | 13,566 | 62 | 0.46% |
| 2015-dated 2-roll set (P&D) | 27,663 | 27,705 | 42 | 0.15% |
| 2014-dated 200-coin bag (P&D)* | 12,967 | 12,967 | – | – |
| 2014-dated 2-roll set (P&D)* | 30,331 | 30,331 | – | – |
| 2013-dated 200-coin bag (P&D)* | 9,980 | 9,980 | – | – |
| 2013-dated 2-roll set (P&D)* | 24,918 | 24,918 | – | – |
| 2012-dated 200-coin bag (P&D)* | 10,323 | 10,323 | – | – |
| 2012-dated 2-roll set (P&D)* | 33,766 | 33,766 | – | – |
America the Beautiful Quarters Uncirculated Coin Set |
||||
| Old Sales |
Latest Sales |
Gain/ Loss |
% Increase |
|
| 2016 Issue* | 29,559 | 29,559 | – | – |
| 2015 Issue | 27,846 | 27,885 | 39 | 0.14% |
| 2014 Issue | 29,869 | 29,886 | 17 | 0.06% |
| 2013 Issue | 42,552 | 42,569 | 17 | 0.04% |
| 2012 Issue* | 42,223 | 42,223 | – | – |
| 2011 Issue | 40,266 | 40,279 | 13 | 0.03% |
| 2010 Issue | 41,598 | 41,610 | 12 | 0.03% |
America the Beautiful Quarters Circulating Coin Set |
||||
| Old Sales |
Latest Sales |
Gain/ Loss |
% Increase |
|
| 2016 Issue | 17,249 | 17,388 | 139 | 0.81% |
| 2015 Issue | 21,081 | 21,113 | 32 | 0.15% |
| 2014 Issue | 23,584 | 23,604 | 20 | 0.08% |
| 2013 Issue | 29,033 | 29,049 | 16 | 0.06% |
| 2012 Issue* | 24,869 | 24,869 | – | – |
| 2011 Issue | 36,278 | 36,295 | 17 | 0.05% |
| 2010 Issue | 39,788 | 39,804 | 16 | 0.04% |
America the Beautiful Quarters Three-Coin Sets |
||||
| Old Sales |
Latest Sales |
Gain/ Loss |
% Increase |
|
| Fort Moultrie | 11,380 | 11,447 | 67 | 0.59% |
| Theodore Roosevelt | 14,188 | 14,220 | 32 | 0.23% |
| Harpers Ferry | 12,928 | 12,949 | 21 | 0.16% |
| Cumberland Gap | 13,796 | 13,809 | 13 | 0.09% |
| Shawnee | 14,270 | 14,302 | 32 | 0.22% |
| Saratoga | 14,628 | 14,633 | 5 | 0.03% |
| Bombay Hook | 13,129 | 13,140 | 11 | 0.08% |
| Blue Ridge Parkway | 16,816 | 16,823 | 7 | 0.04% |
| Kisatchie Set | 14,898 | 14,908 | 10 | 0.07% |
| Homestead Set | 15,876 | 15,881 | 5 | 0.03% |
| Everglades Set | 14,115 | 14,123 | 8 | 0.06% |
| Great Sand Dunes Set | 13,864 | 13,869 | 5 | 0.04% |
| Arches Three-Coin Set | 15,539 | 15,545 | 6 | 0.04% |
| Shenandoah Three-Coin Set | 17,111 | 17,116 | 5 | 0.03% |
| Great Smoky Mountains Set | 18,588 | 18,588 | – | – |
| Mount Rushmore Quarters Set | 17,470 | 17,472 | 2 | 0.01% |
| Fort McHenry Quarters Set | 16,061 | 16,064 | 3 | 0.02% |
| Great Basin Quarters Set | 15,300 | 15,303 | 3 | 0.02% |
| Perry’s Victory Quarters Set | 17,400 | 17,406 | 6 | 0.03% |
| White Mountain Quarters Set | 18,056 | 18,056 | – | – |
| Denali Quarters Set | 17,793 | 17,796 | 3 | 0.02% |
| Hawaii Volcanoes Quarters Set* | 16,508 | 16,647 | – | – |
| Acadia Quarters Set | 19,940 | 19,940 | – | – |
| Chaco Culture Quarters Set | 19,610 | 19,616 | 6 | 0.03% |
| El Yunque Quarters Set* | 19,891 | 19,891 | – | – |
| Chickasaw Quarters Set | 15,988 | 15,992 | 4 | 0.03% |
| Vicksburg Quarters Set | 17,873 | 17,878 | 5 | 0.03% |
| Olympic Quarters Set | 17,496 | 17,499 | 3 | 0.02% |
| Glacier Quarters Set | 18,770 | 18,773 | 3 | 0.02% |
| Gettysburg Quarters Set | 22,456 | 22,459 | 3 | 0.01% |
| Mount Hood Quarters Set | 18,170 | 18,172 | 2 | 0.01% |
| Grand Canyon Quarters Set | 21,813 | 21,817 | 4 | 0.02% |
| Yosemite Quarters Set | 21,838 | 21,840 | 2 | 0.01% |
| Yellowstone Quarters Set | 24,704 | 24,704 | – | – |
| Hot Springs Quarters Set | 22,990 | 22,993 | 3 | 0.01% |
2016 Fort Moultrie Quarters |
||||
| Old Sales |
Latest Sales |
Gain/ Loss |
% Increase |
|
| 100-Coin Bag (S) | 3,973 | 4,001 | 28 | 0.70% |
| 40-Coin Roll (S) | 3,662 | 3,681 | 19 | 0.52% |
| Three-Roll Set | 8,227 | 8,269 | 42 | 0.51% |
| 100-Coin Bag (P) | 2,096 | 2,106 | 10 | 0.48% |
| 100-Coin Bag (D) | 2,026 | 2,040 | 14 | 0.69% |
| Two-Roll Set | 6,724 | 6,741 | 17 | 0.25% |
2016 Theodore Roosevelt Quarters |
||||
| Old Sales |
Latest Sales |
Gain/ Loss |
% Increase |
|
| 100-Coin Bag (S) | 4,559 | 4,569 | 10 | 0.22% |
| 40-Coin Roll (S) | 4,238 | 4,261 | 23 | 0.54% |
| Three-Roll Set | 9,091 | 9,120 | 29 | 0.32% |
| 100-Coin Bag (P) | 2,263 | 2,273 | 10 | 0.44% |
| 100-Coin Bag (D) | 2,114 | 2,120 | 6 | 0.28% |
| Two-Roll Set | 7,360 | 7,373 | 13 | 0.18% |
2016 Harpers Ferry Quarters |
||||
| Old Sales |
Latest Sales |
Gain/ Loss |
% Increase |
|
| 100-Coin Bag (S) | 4,455 | 4,464 | 9 | 0.20% |
| 40-Coin Roll (S) | 4,244 | 4,257 | 13 | 0.31% |
| Three-Roll Set | 9,147 | 9,165 | 18 | 0.20% |
| 100-Coin Bag (P) | 2,150 | 2,154 | 4 | 0.19% |
| 100-Coin Bag (D) | 2,075 | 2,083 | 8 | 0.39% |
| Two-Roll Set | 7,592 | 7,599 | 7 | 0.09% |
2016 Cumberland Gap Quarters |
||||
| Old Sales |
Latest Sales |
Gain/ Loss |
% Increase |
|
| 100-Coin Bag (S) | 4,445 | 4,447 | 2 | 0.04% |
| 40-Coin Roll (S) | 4,259 | 4,267 | 8 | 0.19% |
| Three-Roll Set | 9,200 | 9,214 | 14 | 0.15% |
| 100-Coin Bag (P) | 2,256 | 2,262 | 6 | 0.27% |
| 100-Coin Bag (D) | 2,210 | 2,211 | 1 | 0.05% |
| Two-Roll Set | 7,413 | 7,414 | 1 | 0.01% |
2016 Shawnee Quarters |
||||
| Old Sales |
Latest Sales |
Gain/ Loss |
% Increase |
|
| 100-Coin Bag (S) | 4,732 | 4,737 | 5 | 0.11% |
| 40-Coin Roll (S) | 4,400 | 4,406 | 6 | 0.14% |
| Three-Roll Set | 9,617 | 9,631 | 14 | 0.15% |
| 100-Coin Bag (P) | 2,212 | 2,218 | 6 | 0.27% |
| 100-Coin Bag (D) | 2,161 | 2,167 | 6 | 0.28% |
| Two-Roll Set | 7,603 | 7,604 | 1 | 0.01% |
2015 Saratoga Quarters |
||||
| Old Sales |
Latest Sales |
Gain/
Loss |
% Increase |
|
| 100-Coin Bag (S)* | 4,869 | 4,869 | – | – |
| 40-Coin Roll (S)* | 4,542 | 4,542 | – | – |
| Three-Roll Set* | 9,423 | 9,423 | – | – |
| 100-Coin Bag (P)* | 2,259 | 2,259 | – | – |
| 100-Coin Bag (D)* | 2,212 | 2,212 | – | – |
| Two-Roll Set* | 7,541 | 7,541 | – | – |
Visit the United States Mint website at http://catalog.usmint.gov for product information.