Production of American coins for circulation picked up in May, according to the latest United States Mint figures.
The data also shows mintages for Kentucky’s Cumberland Gap National Historical Park quarter, the second of this year’s five differently designed America the Beautiful Quarters.
Overall, coining presses in May struck more than 1.55 billion in cents, nickels, dimes, and quarters to log increases of 15.8% from April and 6.2% from the same month a year earlier.
The following table shows circulating coin totals by month and their rankings over the past year.
2015 – 2016 May Coin Production Figures
| Month | Mintages | Rank |
| May 2016 | 1,550.12 M | 4 |
| April 2016 | 1,339.06 M | 9 |
| March 2016 | 1,446.14 M | 8 |
| February 2016 | 930.26 M | 12 |
| January 2016 | 1,515.84 M | 5 |
| December 2015 | 707.79 M | 13 |
| November 2015 | 1,245.73 M | 10 |
| October 2015 | 1,757.64 M | 1 |
| September 2015 | 1,476.37 M | 6 |
| August 2015 | 1,142.46 M | 11 |
| July 2015 | 1,665.76 M | 3 |
| June 2015 | 1,673.95 M | 2 |
| May 2015 | 1,459.86 M | 7 |
According to the U.S. Mint’s most recent annual report, the agency spends 1.43 cents to produce and distribute each Lincoln cent. Despite that, the Federal Reserve always orders more of them than any other denomination. In May, the U.S. Mint made 836.8 million in cents, which is 54% of the circulating-quality coins produced for the month.
In the latest month-over month comparisons for coins used daily by Americans, production totals advanced:
- 11% for Lincoln cents,
- 18.6% for Jefferson nickels,
- 21.8% for Roosevelt dimes, and
- 25.1% for America the Beautiful Quarters.
As for other denominations, Presidential $1 Coins, Native American $1 Coins and Kennedy half-dollars are no longer ordered by Federal Reserve Banks but the U.S. Mint continues to make them in circulating quality for coin collectors.
In January, the U.S. Mint struck Native American $1 Coins to the expected amounts needed for all of 2016. That is usually how it works for Kennedy half-dollars but in February another 400,000 were pressed at the Philadelphia Mint and then in March another 400,000 were made at the Denver Mint. In April, the Mint stopped making Presidential $1 Coins with the last ones featuring Ronald Reagan.
Here’s a summary of all circulating-quality coins produced last month:
US Mint Circulating Coin Production in May 2016
| Denomination | Denver | Philadelphia | Total |
| Lincoln Cents | 404,000,000 | 432,800,000 | 836,800,000 |
| Jefferson Nickels | 91,200,000 | 83,520,000 | 174,720,000 |
| Roosevelt Dimes | 137,500,000 | 153,500,000 | 291,000,000 |
| 2016 ATB Quarters | 118,000,000 | 129,600,000 | 247,600,000 |
| Kennedy Half Dollars | 0 | 0 | 0 |
| Native American $1s | 0 | 0 | 0 |
| Presidential Dollars | 0 | 0 | 0 |
| Total | 750,700,000 | 799,420,000 | 1,550,120,000 |
U.S. Mint facilities in Denver and Philadelphia are responsible for manufacturing all of America’s coins for commerce. In May, the Denver Mint produced 750.7 million coins and the Philadelphia Mint produced 799.42 million coins.
Through the first five months of 2016, the Denver Mint made 3,308,900,000 coins and the Philadelphia Mint made 3,472,520,000 coins for a combined 6,781,420,000 coins. The figure marks a 8.1% decline from the 7,377,000,000 coins minted during the same period in 2015.
This next table lists 2016 coin production totals by denomination and by U.S. Mint facility:
YTD 2016 Circulating Coin Production by Denomination
| 1 ¢ | 5 ¢ | 10 ¢ | 25 ¢ | 50 ¢ | N.A. $1 | Pres $1 | Total: | |
|---|---|---|---|---|---|---|---|---|
| Denver | 1938.8M | 339.84M | 576M | 436.2M | 2.1M | 2.1M | 13.86M | 3308.9M |
| Philadelphia | 2033.2M | 343.68M | 620M | 453.8M | 2.1M | 2.8M | 16.94M | 3472.52M |
| Total | 3972M | 683.52M | 1196M | 890M | 4.2M | 4.9M | 30.8M | 6781.42M |
This year’s monthly average of about 1.3 billion coins tracks over 12 months to roughly 16.3 billion coins, which would end up lower than last year. In 2015, the U.S. Mint struck more than 17 billion circulating coins for a sixth straight year of growth and the quickest production pace since the 2001.
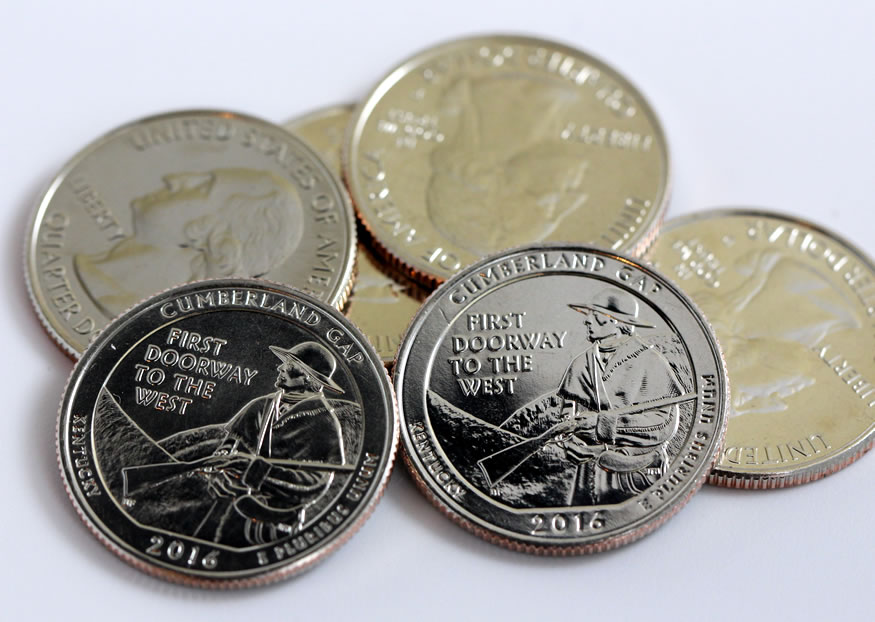
2016 Cumberland Gap Quarter Mintages
Mintages of Cumberland Gap quarters are 223.2 million from Denver and 215.4 million from Philadelphia for a combined 438.6 million.
The amount is 131.2 million higher than the previous release depicting Shawnee National Forest in Illinois, and ranks 8th highest of the 33 quarters issued since the series kicked off in 2010. The U.S. Mint started selling Cumberland Gap quarters on April 4.
The following table breaks down this year’s mintages by coin design:
2016 Circulating Coin Production by Design
| Denver | Philadelphia | Total | |
| Lincoln Cents | 1,938,800,000 | 2,033,200,000 | 3,972,000,000 |
| Jefferson Nickels | 339,840,000 | 343,680,000 | 683,520,000 |
| Roosevelt Dimes | 576,000,000 | 620,000,000 | 1,196,000,000 |
| Shawnee National Forest Quarter | 151,800,000 | 155,600,000 | 307,400,000 |
| Cumberland Gap National Historical Park Quarter | 223,200,000 | 215,400,000 | 438,600,000 |
| Harpers Ferry National Historical Park Quarter | – | – | – |
| Theodore Roosevelt National Park Quarter | – | – | – |
| Fort Moultrie Quarter | – | – | – |
| Kennedy Half Dollars | 2,100,000 | 2,100,000 | 4,200,000 |
| Native American $1 | 2,100,000 | 2,800,000 | 4,900,000 |
| Richard M. Nixon $1 | 4,340,000 | 5,460,000 | 9,800,000 |
| Gerald R. Ford $1 | 5,040,000 | 5,460,000 | 10,500,000 |
| Ronald Reagan $1 | 4,480,000 | 6,020,000 | 10,500,000 |
| Total | 3,247,700,000 | 3,389,720,000 | 6,637,420,000 |
There are 144 million in quarters that the U.S. Mint hasn’t officially assigned to a design yet. They’re actually quarters featuring West Virginia’s Harpers Ferry National Historical Park, and they’re still being produced. The Mint started selling rolls and bags of Harpers Ferry quarters on June 6. Their finalized mintages should be available by July or August.
Coin production figures in this coin news article are based on data aggregated from the Mint’s webpage at: http://www.usmint.gov/about_the_mint/?action=ProductionFigures.


