The cost of producing U.S. circulating coins fell for a fourth straight year, the United States Mint disclosed in its 2015 Annual Report.
That said, the price to make and distribute the nation’s two smallest coins, the Lincoln cent, and Jefferson nickel, remained well above their face values. Their metallic compositions are the main cost drivers. The U.S. Mint has studied alternative metal alloys in an effort to cut costs. Viable solutions have proven to be elusive.
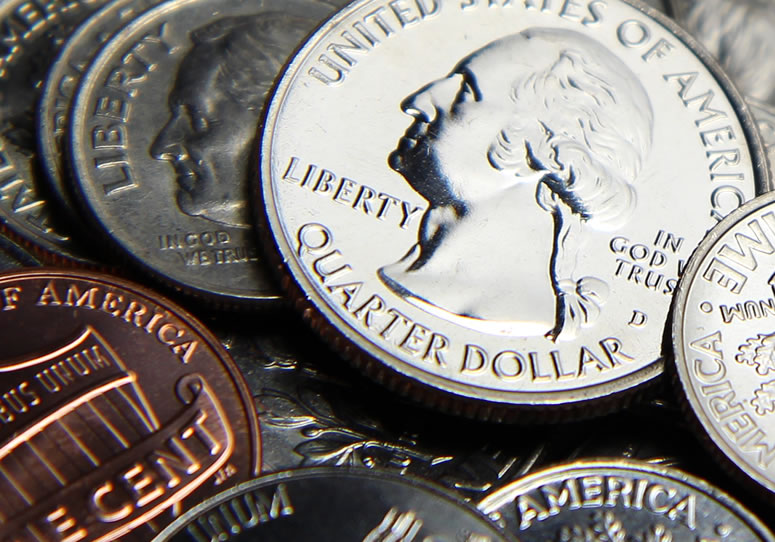
For the Mint’s fiscal year ending September 30, 2015, the total unit cost to produce, administer and distribute the cent was 1.43 cents compared to 1.66 cents in 2014. Similarly, the nickel’s costs totaled 7.44 cents versus 8.09 cent from a year earlier.
"Compared to FY 2014, we reduced the per unit cost of producing the penny by 13.9 percent; the nickel by 8.0 percent; the dime by 9.5 percent; and the quarter by 5.7 percent," Rhett Jeppson, principal deputy director of the United States Mint, noted in the forward of the annual report.
Improved efficiency and lower metal prices contributed to their declines, which boosted overall gains in seigniorage. Seigniorage is the difference between the face values of coins and their costs.
"We also returned $550 million in seigniorage to the Treasury General Fund in FY 2015, more than double the amount we returned last fiscal year," Jeppson said.
The U.S. Mint made money on dimes and quarters, with their total unit costs at 3.54 cents and 8.44 cents. These compare to FY 2014 tallies of 3.91 cents and 8.95 cents.
For the FY 2015, the U.S. Mint shipped to Federal Reserve Banks a total of:
- 9.155 billion cents;
- 1.477 billion nickels;
- 2.874 billion dimes; and
- 2.645 billion quarters.
The four denominations combined to 16.151 billion coins, marking a 23.9% increase over the 13.037 billion coins delivered to Fed banks in FY 2014.
Unit Cost to Produce and Distribute Lincoln Cent
| FY 2014 | FY 2015 | |
| Cost of Goods Sold | 0.0143 | 0.0125 |
| Sales, General & Administrative | 0.0021 | 0.0015 |
| Distribution to Reserve Banks | 0.0002 | 0.0003 |
| Total Unit Cost | 0.0166 | 0.0143 |
Unit Cost to Produce and Distribute Jefferson Nickel
| FY 2014 | FY 2015 | |
| Cost of Goods Sold | 0.0699 | 0.0664 |
| Sales, General & Administrative | 0.0102 | 0.0068 |
| Distribution to Reserve Banks | 0.0008 | 0.0012 |
| Total Unit Cost | 0.0809 | 0.0744 |
The two smallest U.S. coins have lost money since 2006.
Unit Costs and Seigniorage for Cent and Nickel from 2005 to 2015
| Fiscal Year | Cent Unit Cost | Nickel Unit Cost | Seigniorage (in millions) |
|---|---|---|---|
| 2005 | 0.0097 | 0.0484 | $4.40 |
| 2006 | 0.0121 | 0.0597 | ($32.90) |
| 2007 | 0.0167 | 0.0953 | ($98.60) |
| 2008 | 0.0142 | 0.0883 | ($47.00) |
| 2009 | 0.0162 | 0.0603 | ($22.00) |
| 2010 | 0.0179 | 0.0922 | ($42.60) |
| 2011 | 0.0241 | 0.1118 | ($116.70) |
| 2012 | 0.0200 | 0.1009 | ($109.20) |
| 2013 | 0.0183 | 0.0941 | ($104.50) |
| 2014 | 0.0166 | 0.0809 | ($90.50) |
| 2015 | 0.0143 | 0.0744 | ($74.40) |


