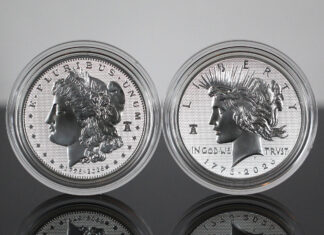
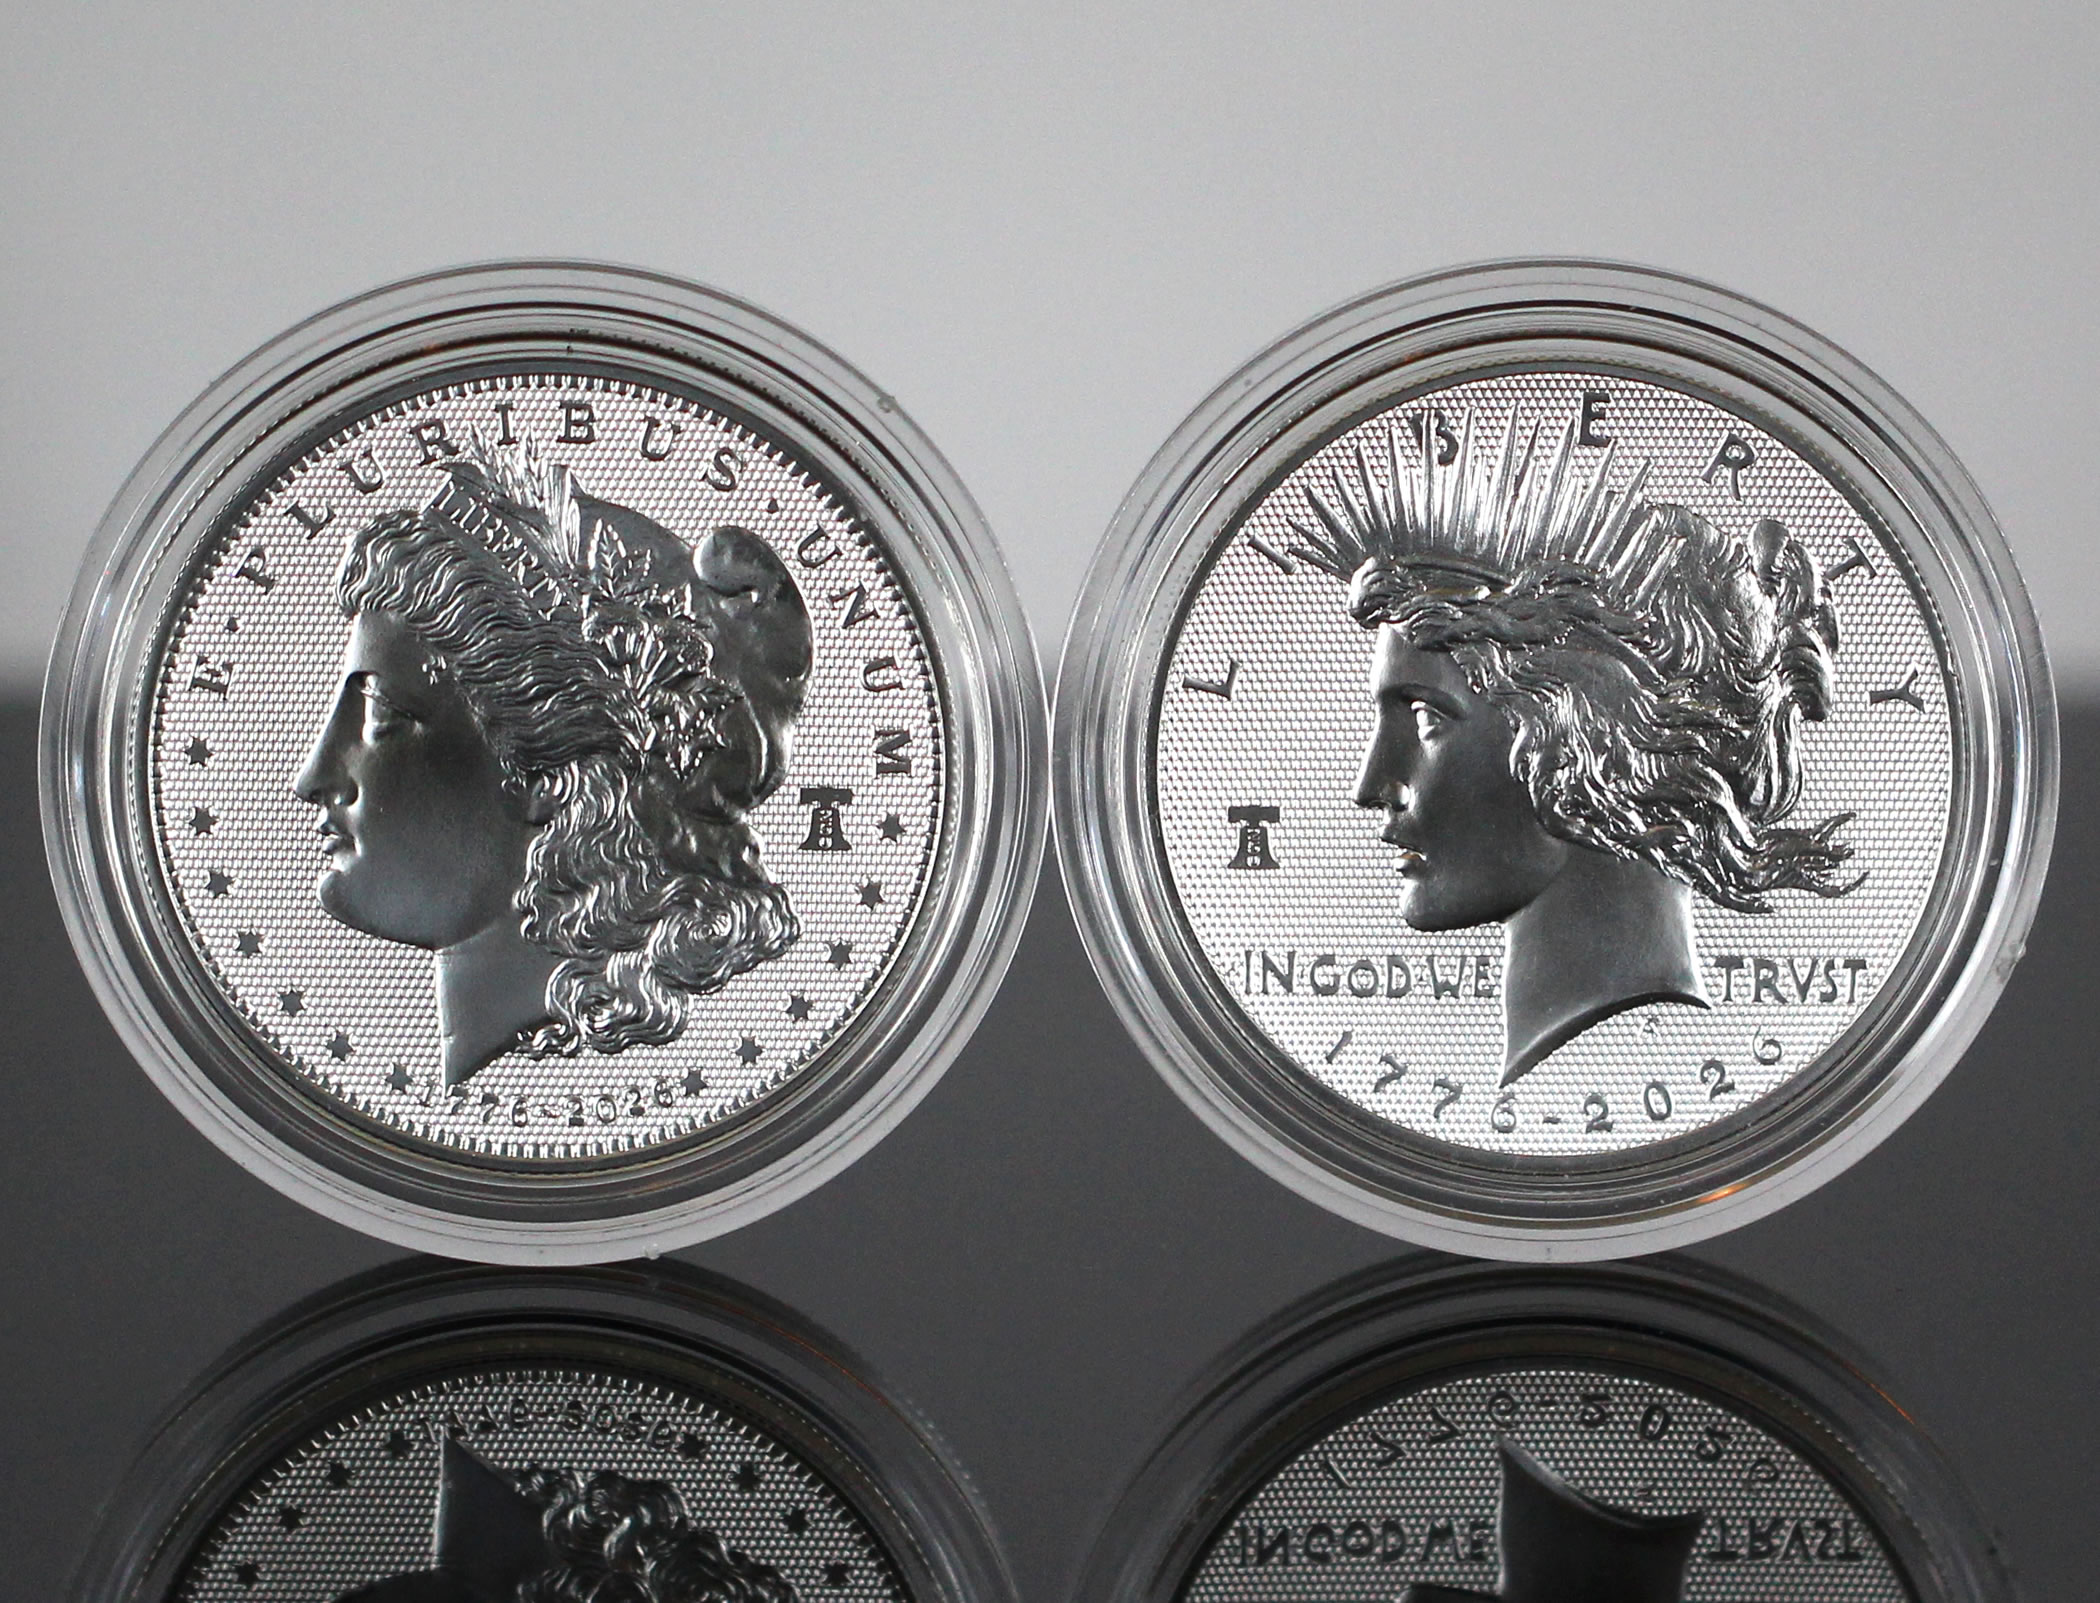
New products dominated the U.S. Mint’s latest sales report, led by the 2026-P Diamond Field Morgan and Peace Silver Dollar Set, which opened with sales of 120,884. Released Nov. 12 for $375, the two-coin set features a newly developed diamond-patterned finish, highlighted in recent CoinNews photos. That figure represents 46.1% of the 262,500 product limit.
Those sales represent 241,768 individual coins, exceeding the combined opening total of 202,420 for the enhanced uncirculated Morgan and Peace dollars released in August, but trailing the 303,742 reverse proof dollars sold during their first reporting period in July. The table below compares initial and latest reported sales for all three 2026 releases.
2026 Morgan and Peace Silver Dollar Sales Comparison
| 2026 Morgan and Peace Dollar Release | Opening Sales | Latest Sales |
|---|---|---|
| Reverse Proof Morgan Dollar (July 9) | 158,647 | 167,457 |
| Reverse Proof Peace Dollar (July 9) | 145,095 | 151,311 |
| Reverse Proof Combined (July 9) | 303,742 | 318,768 |
| Enhanced Uncirculated Morgan Dollar (Aug. 25) | 105,147 | 103,927 |
| Enhanced Uncirculated Peace Dollar (Aug. 25) | 97,273 | 96,108 |
| Enhanced Uncirculated Combined (Aug. 25) | 202,420 | 200,035 |
| Diamond Field Morgan & Peace Dollar Set | 120,884 sets (241,768 coins) | 120,884 sets (241,768 coins) |
Note: Diamond Field dollars are sold exclusively as two-coin sets, while the reverse proof and enhanced uncirculated dollars were offered individually.
Gettysburg Address Quarter Rolls and Bags Debut
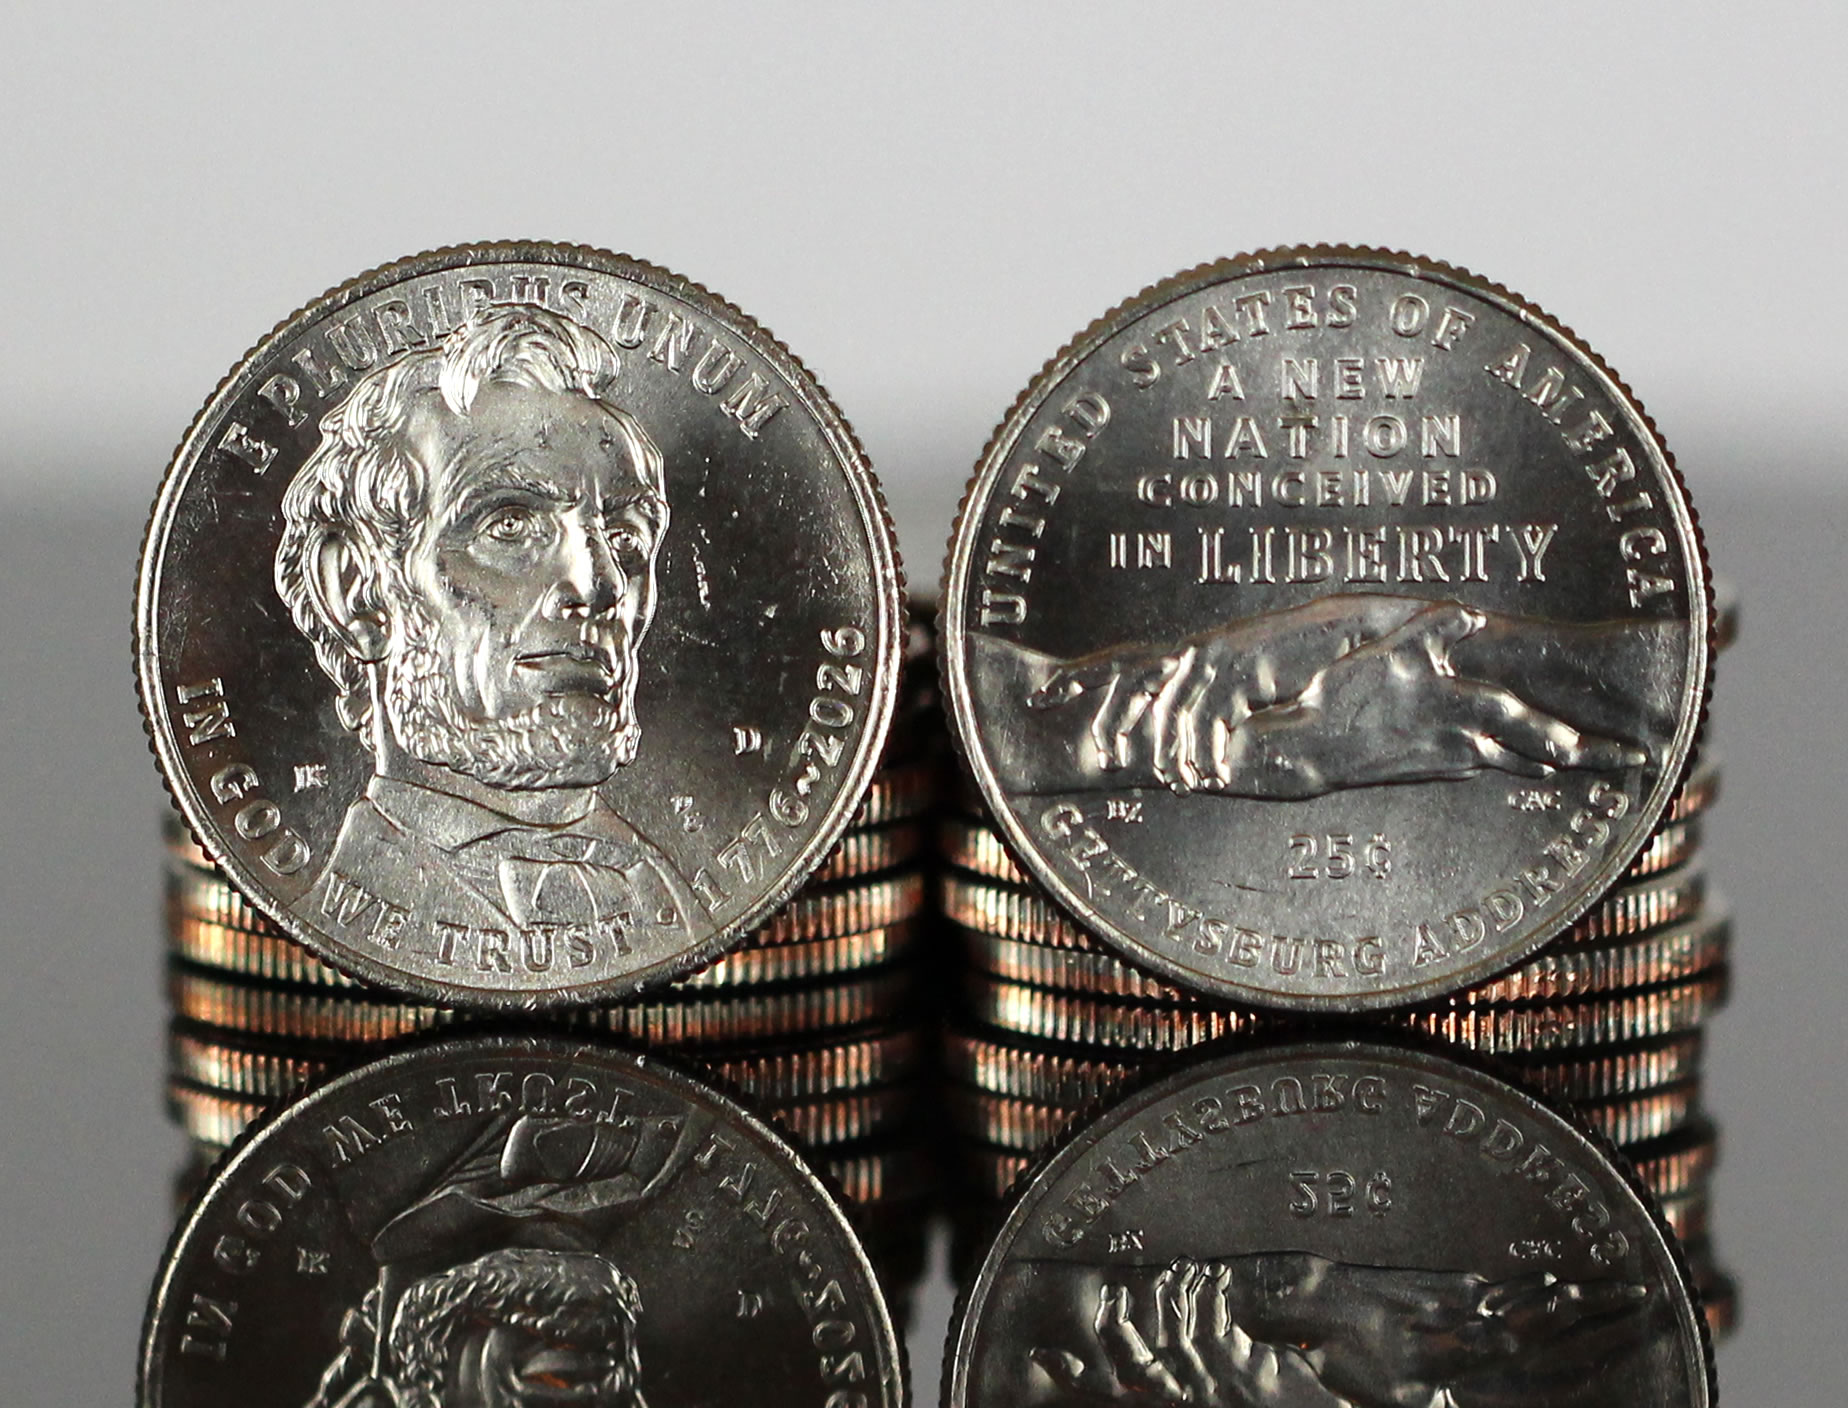
Gettysburg Address quarter rolls and bags also posted strong opening sales following their Nov. 13 release. Two-roll sets started at 8,718, while Philadelphia and Denver 100-coin bags reached 5,715 and 5,646, respectively. Together, the three products accounted for 1,833,540 quarters, completing the Mint’s 2026 series of collector rolls and bags featuring five one-year-only designs.
That total was below the opening sales of the preceding U.S. Constitution quarter products, which reached 2,040,960 coins. The Declaration of Independence and Revolutionary War offerings posted similar initial totals of 2,021,040 and 2,021,440 coins, respectively. The Mayflower Compact quarter was an exception, starting at 1,015,420 coins because of lower initial product limits, although additional inventory later pushed its combined sales above 2 million.
The lower Gettysburg Address total, however, does not indicate weaker collector demand. Rolls and bags for all the 2026 quarter designs became unavailable shortly after their launches, making initial sales more reflective of the quantities offered by the Mint than differences in demand.
Weekly Sales Gains Strengthen With New Releases
Six products registered increases exceeding 1,000 units, up from two in the previous report. Four of the ten best sellers were newly released products, led by the Diamond Field Morgan and Peace Silver Dollar Set with 120,884 sales. Among the other top sellers, four posted gains ranging from 507 to 873 units.
U.S. Mint Top Sellers
Below is a list of the U.S. Mint’s best-selling numismatic products for the reporting period ending Nov. 15.
- 2026-P Diamond Field Morgan and Peace Silver Dollar Set (+120,884)
- 2026 P&D Gettysburg Address Quarters Two-Roll Sets (+8,718)
- 2026-P Gettysburg Address Quarters in 100-Coin Bags (+5,715)
- 2026-D Gettysburg Address Quarters in 100-Coin Bags (+5,646)
- 2026 Proof Set (+3,981 to 379,530)
- 2026-W Proof Silver Eagle (+1,385 to 455,758)
- 2026 American Innovation Dollar Reverse Proof Set (+873 to 50,141)
- 2026 P&D Enduring Liberty Half Dollars 200-Coin Bags (+765 to 49,420)
- 2026-P Reverse Proof Peace Silver Dollar (+575 to 151,311)
- 2026-P Reverse Proof Morgan Silver Dollar (+507 to 167,457)
In its latest report, the Mint published sales data for 704 numismatic products.
One hundred products posted larger weekly increases than in the previous report, up from 75 a week earlier. However, such comparisons are less meaningful this year because so many of the Mint’s 2026-dated products are unavailable.
Products Posting Declines
Nine products registered week-over-week declines, down from 11 in the prior reporting period. Most posted only minor decreases. Products with losses of more than one unit include:
- 2026-P U.S. Constitution Quarters in 100-Coin Bags — down 2 to 6,189
- 2026-D U.S. Constitution Quarters in 100-Coin Bags — down 3 to 6,181
- 2026-P Enduring Liberty 9/11 Half Dollars 100-Coin Bag — down 14 to 26,403
- 2026-P Enduring Liberty 9/11 Half Dollars 20-Coin Roll — down 26 to 47,698
US Mint Sales: Numismatic Products
Below are tables showing the latest available sales for U.S. Mint numismatic products. The sales period covers Nov. 9 through Nov. 15. Products with an asterisk (*) are no longer available or had no reported sales.
2026 Commemorative Coins | ||||
| Old Sales | Latest Sales | Gain/ Loss | % Increase | |
| 2026-P Uncirculated FIFA World Cup Half Dollar | 6,564 | 6,589 | 25 | 0.38% |
| 2026-P Proof FIFA World Cup Half Dollar | 17,626 | 17,681 | 55 | 0.31% |
| 2026-P Uncirculated FIFA World Cup Silver Dollar | 5,067 | 5,074 | 7 | 0.14% |
| 2026-P Proof FIFA World Cup Silver Dollar | 19,322 | 19,393 | 71 | 0.37% |
| 2026-W $5 Uncirculated FIFA World Cup Gold Coin | 780 | 800 | 20 | 2.56% |
| 2026-W $5 Proof FIFA World Cup Gold Coin | 1,242 | 1,243 | 1 | 0.08% |
| 2026 FIFA World Cup Three-Coin Proof Set | 2,808 | 2,814 | 6 | 0.21% |
2025 Commemorative Coins | ||||
| Old Sales | Latest Sales | Gain/ Loss | % Increase | |
| 2025-S Proof U.S. Marine Corps 250th Anniversary Half Dollar | 24,037 | 24,037 | – | – |
| 2025-S Uncirculated U.S. Marine Corps 250th Anniversary Half Dollar | 9,836 | 9,836 | – | – |
| 2025-P Proof U.S. Marine Corps 250th Anniversary Silver Dollar | 55,487 | 55,487 | – | – |
| 2025-P Uncirculated U.S. Marine Corps 250th Anniversary Silver Dollar | 12,906 | 12,906 | – | – |
| 2025-W Proof U.S. Marine Corps 250th Anniversary $5 Gold Coin | 2,093 | 2,093 | – | – |
| 2025-W Uncirculated U.S. Marine Corps 250th Anniversary $5 Gold Coin | 1,472 | 1,472 | – | – |
| 2025 U.S. Marine Corps 250th Anniversary Three-Coin Proof Set | 7,340 | 7,340 | – | – |
Morgan & Peace Silver Dollars | ||||
| Old Sales | Latest Sales | Gain/ Loss | % Increase | |
| 2026-P Diamond Field Morgan and Peace Silver Dollar Set | – | 120,884 | – | – |
| 2026 (W) Enhanced Uncirculated Morgan Silver Dollar | 103,584 | 103,927 | 343 | 0.33% |
| 2026 (W) Enhanced Uncirculated Peace Silver Dollar | 95,848 | 96,108 | 260 | 0.27% |
| 2026-P Reverse Proof Morgan Silver Dollar | 166,950 | 167,457 | 507 | 0.30% |
| 2026-P Reverse Proof Peace Silver Dollar | 150,736 | 151,311 | 575 | 0.38% |
| 2025-S Reverse Proof Morgan & Peace Silver Dollar Set | 123,008 | 123,077 | 69 | 0.06% |
| 2025-S Proof Morgan Silver Dollar | 147,351 | 147,375 | 24 | 0.02% |
| 2025-S Proof Morgan Silver Dollar (Bulk – 40 Coins) | 328 | 328 | – | – |
| 2025-S Proof Peace Silver Dollar | 130,010 | 130,019 | 9 | 0.01% |
| 2025-S Proof Peace Silver Dollar (Bulk – 40 Coins) | 328 | 328 | – | – |
| 2025-P Uncirculated Morgan Silver Dollar | 113,760 | 113,781 | 21 | 0.02% |
| 2025-P Uncirculated Morgan Silver Dollar (40 – Bulk) | 318 | 318 | – | – |
| 2025-P Uncirculated Peace Silver Dollar | 106,505 | 106,511 | 6 | 0.01% |
| 2025-P Uncirculated Peace Silver Dollar (40 – Bulk) | 320 | 320 | – | – |
| 2024-S Reverse Proof Morgan & Peace Silver Dollar Set | 160,839 | 160,879 | 40 | 0.02% |
| 2024-S Proof Morgan Silver Dollar | 178,857 | 178,863 | 6 | 0.00% |
| 2024-S Proof Morgan Silver Dollar (Bulk – 40 Coins) | 304 | 304 | – | – |
| 2024-S Proof Peace Silver Dollar | 159,723 | 159,730 | 7 | 0.00% |
| 2024-S Proof Peace Silver Dollar (Bulk – 40 Coins) | 304 | 304 | – | – |
| 2024-P Uncirculated Morgan Silver Dollar | 168,374 | 168,375 | 1 | 0.00% |
| 2024-P Uncirculated Morgan Silver Dollar (40 – Bulk) | 316 | 316 | – | – |
| 2024-P Uncirculated Peace Silver Dollar | 158,988 | 158,990 | 2 | 0.00% |
| 2024-P Uncirculated Peace Silver Dollar (40 – Bulk) | 309 | 309 | – | – |
| 2023-S Reverse Proof Morgan & Peace Silver Dollar Set | 247,820 | 247,820 | – | – |
| 2023-S Proof Morgan Silver Dollar | 366,868 | 366,871 | 3 | 0.00% |
| 2023-S Proof Morgan Silver Dollar (Bulk – 40 Coins) | 443 | 443 | – | – |
| 2023-S Proof Peace Silver Dollar | 330,666 | 330,668 | 2 | 0.00% |
| 2023-S Proof Peace Silver Dollar (Bulk – 40 Coins) | 438 | 438 | – | – |
| 2023-P Uncirculated Morgan Silver Dollar | 260,527 | 260,527 | – | – |
| 2023-P Uncirculated Morgan Silver Dollar (40 – Bulk) | 330 | 330 | – | – |
| 2023-P Uncirculated Peace Silver Dollar | 260,450 | 260,450 | – | – |
| 2023-P Uncirculated Peace Silver Dollar (40 – Bulk) | 338 | 338 | – | – |
Comic Art Coins and Medals | ||||
| Old Sales | Latest Sales | Gain/ Loss | % Increase | |
| 2026-W $50 Proof Supergirl Gold Coin | 500 | 503 | 3 | 0.60% |
| 2026 Supergirl 2.5-Ounce Silver Medal | 1,609 | 1,632 | 23 | 1.43% |
| 2026 Supergirl 1-Ounce Silver Medal | 9,654 | 9,673 | 19 | 0.20% |
| Superman, Batman and Wonder Woman Three-Medal Set | 4,936 | 4,963 | 27 | 0.55% |
| 2025-W $50 Proof Wonder Woman Gold Coin | 1,889 | 1,889 | – | – |
| 2025 Wonder Woman 2.5-Ounce Silver Medal | 6,832 | 6,840 | 8 | 0.12% |
| 2025 Wonder Woman 1-Ounce Silver Medal | 19,021 | 19,041 | 20 | 0.11% |
| 2025-W $50 Proof Batman Gold Coin | 2,372 | 2,372 | – | – |
| 2025 Batman 2.5 Ounce Silver Medal | 9,183 | 9,191 | 8 | 0.09% |
| 2025 Batman 1 Ounce Silver Medal | 23,216 | 23,235 | 19 | 0.08% |
| 2025-W $50 Proof Superman Gold Coin | 5,842 | 5,849 | 7 | 0.12% |
| 2025 Superman 2.5 Ounce Silver Medal | 16,174 | 16,183 | 9 | 0.06% |
| 2025 Superman 1 Ounce Silver Medal | 30,431 | 30,434 | 3 | 0.01% |
2026 Best of Mint Series | ||||
| Old Sales | Latest Sales | Gain/ Loss | % Increase | |
| 1907 Saint-Gaudens High Relief $20 Gold Coin and Silver Medal Set | 9,351 | 9,406 | 55 | 0.59% |
| 1804 Silver Dollar Gold Coin and Silver Medal Set | 12,313 | 12,336 | 23 | 0.19% |
| 1916 Walking Liberty Half Dollar Gold Coin and Silver Medal Set | 10,456 | 10,485 | 29 | 0.28% |
| 1916 Standing Liberty Quarter Gold Coin and Silver Medal Set | 17,074 | 17,120 | 46 | 0.27% |
| 1916 Mercury Dime Gold Coin and Silver Medal Set | 29,714 | 29,733 | 19 | 0.06% |
Freedom Ringing Series | ||||
| Old Sales | Latest Sales | Gain/ Loss | % Increase | |
| 1776 ~ 2026 $250 Freedom Ringing Liberty Bell 1-Ounce Gold Coin | 992 | 998 | 6 | 0.60% |
| 1776 ~ 2026 $125 Freedom Ringing 1/2-Ounce Gold Coin | 1,023 | 1,036 | 13 | 1.27% |
| 1776 ~ 2026 Freedom Ringing Liberty Bell 1/2 Ounce Silver Medal | 1,924 | 1,926 | 2 | 0.10% |
250th Anniversary Coins & Medals | ||||
| Old Sales | Latest Sales | Gain/ Loss | % Increase | |
| 1776 ~ 2026 President Donald J. Trump $1 25-Coin Roll | 149,895 | 149,896 | 1 | 0.00% |
| 1776 ~ 2026 President Donald J. Trump $1 100-Coin Bag | 49,916 | 49,915 | -1 | 0.00% |
| 2026 Freedom 250 Race Medal | 11,071 | 11,070 | -1 | -0.01% |
25th Anniversary | ||||
| Old Sales | Latest Sales | Gain/ Loss | % Increase | |
| 2025-W Proof Sacagawea Gold Dollar Coin | 7,478 | 7,478 | – | – |
230th Anniversary Flowing Hair | ||||
| Old Sales | Latest Sales | Gain/ Loss | % Increase | |
| 2024 Flowing Hair Gold Coin | 9,986 | 9,986 | – | – |
| 2024 Flowing Hair Silver Medal (Includes 8,926 from Bulk Sales) | 49,984 | 49,984 | – | – |
Armed Forces Silver Medals | ||||
| Old Sales | Latest Sales | Gain/ Loss | % Increase | |
| U.S. Army 2.5 Ounce Silver Medal | 9,988 | 9,988 | – | – |
| U.S. Marine Corps 2.5 Ounce Silver Medal | 9,988 | 9,988 | – | – |
| U.S. Navy 2.5 Ounce Silver Medal | 9,987 | 9,987 | – | – |
| U.S. Coast Guard 2.5 Ounce Silver Medal | 9,955 | 9,955 | – | – |
| U.S. Air Force 2.5 Ounce Silver Medal | 9,953 | 9,953 | – | – |
| U.S. Army 1 Ounce Silver Medal | 25,435 | 25,470 | 35 | 0.14% |
| U.S. Marine Corps 1 Ounce Silver Medal | 29,108 | 29,194 | 86 | 0.30% |
| U.S. Navy 1 Ounce Silver Medal | 29,604 | 29,649 | 45 | 0.15% |
| U.S. Coast Guard 1 Ounce Silver Medal | 22,463 | 22,475 | 12 | 0.05% |
| U.S. Air Force 1 Ounce Silver Medal | 27,843 | 27,858 | 15 | 0.05% |
American Liberty Products | ||||
| Old Sales | Latest Sales | Gain/ Loss | % Increase | |
| 2025-W $100 American Liberty Gold Coin | 11,939 | 11,939 | – | – |
| 2025-P American Liberty Silver Medal | 29,960 | 29,960 | – | – |
| 2023-W $100 American Liberty Gold Coin | 12,196 | 12,196 | – | – |
| 2023-P American Liberty Silver Medal | 44,793 | 44,799 | 6 | 0.01% |
| 2022-P American Liberty Silver Medal | 74,414 | 74,414 | – | – |
| 2021-W $100 American Liberty Gold Coin | 12,471 | 12,471 | – | – |
| 2019-W $100 American Liberty Gold Coin | 24,609 | 24,609 | – | – |
| 2019-P American Liberty Silver Medal | 44,928 | 44,928 | – | – |
| 2018-W $10 American Liberty Gold Coin | 73,293 | 73,293 | – | – |
| 2017 American Liberty Silver Four-Medal Set* | 32,647 | 32,647 | – | – |
| 2017-W $100 American Liberty Gold Coin | 49,697 | 49,697 | – | – |
| 2017-P Proof American Liberty Silver Medal* | 55,187 | 55,187 | – | – |
Clad Proof Sets | ||||
| Old Sales | Latest Sales | Gain/ Loss | % Increase | |
| 2026 Proof Set | 375,549 | 379,530 | 3,981 | 1.06% |
| 2025 Proof Set* | 304,807 | 304,807 | – | – |
| 2024 Proof Set* | 355,786 | 355,786 | – | – |
| 2023 Proof Set* | 369,236 | 369,236 | – | – |
| 2022 Proof Set* | 400,002 | 400,002 | – | – |
| 2021 Proof Set* | 512,866 | 512,866 | – | – |
| 2020 Proof Set* | 464,730 | 464,730 | – | – |
| 2019 Proof Set* | 601,364 | 601,364 | – | – |
| 2018 Proof Set* | 517,081 | 517,081 | – | – |
| 2017 Proof Set* | 568,678 | 568,678 | – | – |
| 2025 American Innovation Dollars Proof Set | 61,610 | 61,610 | – | – |
| 2024 American Innovation Dollars Proof Set | 66,049 | 66,049 | – | – |
| 2023 American Innovation Dollars Proof Set | 61,845 | 61,845 | – | – |
| 2022 American Innovation Dollars Proof Set | 87,328 | 87,343 | 15 | 0.02% |
| 2021 American Innovation Dollars Proof Set | 93,074 | 93,088 | 14 | 0.02% |
| 2020 American Innovation Dollars Proof Set | 108,400 | 108,400 | – | – |
| 2019 American Innovation Dollars Proof Set | 149,885 | 149,885 | – | – |
| 2025 American Women Quarters Proof Set | 33,927 | 33,927 | – | – |
| 2024 American Women Quarters Proof Set | 51,916 | 51,916 | – | – |
| 2023 American Women Quarters Proof Set | 60,934 | 60,934 | – | – |
| 2022 American Women Quarters Proof Set* | 42,821 | 42,821 | – | – |
| 2020 America the Beautiful Quarters Proof Set* | 64,242 | 64,242 | – | – |
| 2019 America the Beautiful Quarters Proof Set | 84,697 | 84,697 | – | – |
| 2018 America the Beautiful Quarters Proof Set* | 86,697 | 86,697 | – | – |
Silver Proof Sets | ||||
| Old Sales | Latest Sales | Gain/ Loss | % Increase | |
| 2026 Silver Proof Set | 267,016 | 267,036 | 20 | 0.01% |
| 2025 Silver Proof Set* | 124,178 | 124,178 | – | – |
| 2024 Silver Proof Set* | 170,435 | 170,435 | – | – |
| 2023 Silver Proof Set | 203,064 | 203,099 | 35 | 0.02% |
| 2022 Silver Proof Set* | 249,372 | 249,372 | – | – |
| 2021 Silver Proof Set | 308,871 | 308,875 | 4 | 0.00% |
| 2020 Silver Proof Set* | 313,183 | 313,183 | – | – |
| 2019 Silver Proof Set* | 415,382 | 415,382 | – | – |
| 2018 Silver Proof Set* | 332,273 | 332,273 | – | – |
| 2018 Silver Reverse Proof Set* | 199,116 | 199,116 | – | – |
| 2025 American Women Quarters Silver Proof Set | 26,629 | 26,629 | – | – |
| 2024 American Women Quarters Silver Proof Set | 35,010 | 35,010 | – | – |
| 2023 American Women Quarters Silver Proof Set | 47,278 | 47,278 | – | – |
| 2022 American Women Quarters Silver Proof Set | 57,768 | 57,768 | – | – |
| 2020 America the Beautiful Quarters Silver Proof Set* | 64,012 | 64,012 | – | – |
| 2019 America the Beautiful Quarters Silver Proof Set* | 78,588 | 78,588 | – | – |
| 2018 America the Beautiful Quarters Silver Proof Set* | 79,301 | 79,301 | – | – |
| 2026 Congratulations Gift Set | 60,007 | 60,008 | 1 | 0.00% |
| 2025 Congratulations Gift Set | 36,507 | 36,519 | 12 | 0.03% |
| 2024 Congratulations Gift Set | 28,098 | 28,100 | 2 | 0.01% |
| 2023 Congratulations Gift Set | 39,412 | 39,412 | – | – |
| 2022 Congratulations Gift Set | 29,710 | 29,710 | – | – |
| 2021 Congratulations Gift Set* | 39,997 | 39,997 | – | – |
| 2020 Congratulations Gift Set* | 24,468 | 24,468 | – | – |
| 2019 Congratulations Gift Set* | 31,638 | 31,638 | – | – |
| 2025 Limited Edition Silver Proof Set | 24,891 | 24,891 | – | – |
| 2024 Limited Edition Silver Proof Set | 32,664 | 32,692 | 28 | 0.09% |
| 2023 Limited Edition Silver Proof Set | 32,991 | 32,995 | 4 | 0.01% |
| 2022 Limited Edition Silver Proof Set* | 49,733 | 49,733 | – | – |
| 2021 Limited Edition Silver Proof Set* | 49,852 | 49,852 | – | – |
| 2020 Limited Edition Silver Proof Set* | 50,061 | 50,061 | – | – |
US Mint Uncirculated Sets | ||||
| Old Sales | Latest Sales | Gain/ Loss | % Increase | |
| 2026 Uncirculated Mint Set | 298,650 | 298,659 | 9 | 0.00% |
| 2025 Uncirculated Mint Set | 188,829 | 188,829 | – | – |
| 2024 Uncirculated Mint Set | 188,970 | 188,978 | 8 | 0.00% |
| 2023 Uncirculated Mint Set | 184,349 | 184,349 | – | – |
| 2022 Uncirculated Mint Set* | 249,964 | 249,964 | – | – |
| 2021 Uncirculated Mint Set | 241,230 | 241,257 | 27 | 0.01% |
| 2020 Uncirculated Mint Set* | 211,787 | 211,787 | – | – |
| 2019 Uncirculated Mint Set* | 346,117 | 346,117 | – | – |
| 2018 Uncirculated Mint Set* | 257,536 | 257,536 | – | – |
| 2017 Uncirculated Mint Set* | 286,813 | 286,813 | – | – |
| 2017-S Enhanced Uncirculated Set* | 210,419 | 210,419 | – | – |
Kids Coin Sets | ||||
| Old Sales | Latest Sales | Gain/ Loss | % Increase | |
| 2019 Youth Coin and Currency Set | 24,888 | 24,888 | – | – |
| 2019 Explore and Discover Coin Set | 48,799 | 48,799 | – | – |
| 2019 Rocketship* | 49,921 | 49,921 | – | – |
| 2014 Coin Discovery Set* | 13,151 | 13,151 | – | – |
Ornaments | ||||
| Old Sales | Latest Sales | Gain/ Loss | % Increase | |
| 2025 Mighty Minters Ornament | 3,635 | 3,645 | 10 | 0.28% |
| 2025 U.S. Mint Ornament | 4,964 | 4,964 | – | – |
| 2025 Ida B. Wells Quarter Ornament | 882 | 882 | – | – |
| 2025 Juliette Gordon Low Quarter Ornament | 1,767 | 1,767 | – | – |
| 2025 Dr. Vera Rubin Quarter Ornament | 900 | 900 | – | – |
| 2025 Stacey Park Milbern Quarter Ornament | 831 | 831 | – | – |
| 2025 Althea Gibson Quarter Ornament | 939 | 939 | – | – |
| 2024 Mighty Minters Ornament | 4,107 | 4,117 | 10 | 0.24% |
| 2024 U.S. Mint Ornament | 4,982 | 4,982 | – | – |
| 2024 Rev. Dr. Pauli Murray Ornament | 960 | 960 | – | – |
| 2024 Patsy Takemoto Mink Ornament | 1,016 | 1,016 | – | – |
| 2024 Dr. Mary Edwards Walker Ornament | 1,212 | 1,212 | – | – |
| 2024 Celia Cruz Ornament | 2,410 | 2,410 | – | – |
| 2024 Zitkala-Ša Ornament | 985 | 985 | – | – |
| 2023 U.S. Mint Ornament | 5,836 | 5,844 | 8 | 0.14% |
| 2023 Mighty Minters Ornament | 3,607 | 3,612 | 5 | 0.14% |
| 2022 U.S. Mint Ornament | 6,453 | 6,459 | 6 | 0.09% |
| 2022 Mighty Minters Ornament | 4,572 | 4,579 | 7 | 0.15% |
| 2023 Bessie Coleman Ornament | 1,409 | 1,409 | – | – |
| 2023 Edith Kanakaʻole Ornament; | 1,593 | 1,593 | – | – |
| 2023 Eleanor Roosevelt Ornament | 2,007 | 2,007 | – | – |
| 2023 Jovita Idar Ornament | 1,391 | 1,391 | – | – |
| 2023 Maria Tallchief Ornament | 1,642 | 1,642 | – | – |
| 2022 Maya Angelou Ornament | 3,702 | 3,702 | – | – |
| 2022 Dr. Sally Ride Ornament | 3,759 | 3,759 | – | – |
| 2022 Wilma Mankiller Ornament | 2,505 | 2,505 | – | – |
| 2022 Nina Otero-Warren Ornament | 1,910 | 1,910 | – | – |
| 2022 Anna May Wong Ornament | 3,433 | 3,433 | – | – |
| 2021 Mighty Minters Ornament | 4,821 | 4,821 | – | – |
| 2021 U.S. Mint Ornament | 7,975 | 7,975 | – | – |
| 2020 Mighty Minters Ornament | 4,594 | 4,594 | – | – |
| 2020 U.S. Mint Ornament | 6,719 | 6,719 | – | – |
| 2019 Mighty Minters Ornament | 7,113 | 7,113 | – | – |
| 2019 U.S. Mint Ornament | 11,986 | 11,986 | – | – |
Proof & Reverse Proof Silver Eagles | ||||
| Old Sales | Latest Sales | Gain/ Loss | % Increase | |
| 2026-W Proof Silver Eagle | 454,373 | 455,758 | 1,385 | 0.30% |
| 2025-P 250th Anniversary U.S. Marine Corps Proof Silver Eagle | 99,748 | 99,748 | – | – |
| 2025-S Proof 250th Anniversary U.S. Navy Silver Eagle | 99,891 | 99,891 | – | – |
| 2025-W Proof Laser Engraved Silver Eagle | 99,295 | 99,295 | – | – |
| 2025-W Proof 250th Anniversary U.S. Army Silver Eagle | 99,963 | 99,963 | – | – |
| 2025-S Proof Silver Eagle | 109,662 | 109,662 | – | – |
| 2025-S Proof Silver Eagle (Bulk – 40 Coins) | 552 | 552 | – | – |
| 2025-W Proof Silver Eagle | 299,322 | 299,322 | – | – |
| 2025-W Proof Silver Eagle (Bulk – 40 Coins) | 801 | 801 | – | – |
| 2024-S Proof Silver Eagle | 146,441 | 146,453 | 12 | 0.01% |
| 2024-S Proof Silver Eagle (Bulk – 40 Coins) | 915 | 915 | – | – |
| 2024-W Proof Silver Eagle | 293,793 | 293,795 | 2 | 0.00% |
| 2024-W Proof Silver Eagle (Bulk – 40 Coins) | 1,543 | 1,543 | – | – |
| 2023-S Proof Silver Eagle | 191,003 | 191,010 | 7 | 0.00% |
| 2023-S Proof Silver Eagle (Bulk – 40 Coins) | 743 | 743 | – | – |
| 2022-S Proof Silver Eagle | 199,698 | 199,698 | – | – |
| 2022-S Proof Silver Eagle (Bulk – 40 Coins) | 2,925 | 2,925 | – | – |
| 2023-W Proof Silver Eagle | 436,491 | 436,491 | – | – |
| 2023-W Proof Silver Eagle (Bulk – 40 Coins) | 2,118 | 2,118 | – | – |
| 2022-W Proof Silver Eagle | 496,994 | 496,994 | – | – |
| 2022-W Proof Silver Eagle (Bulk – 40 Coins) | 4,171 | 4,171 | – | – |
| 2021 Reverse Proof American Silver Eagle Two-Coin Set* | 124,918 | 124,918 | – | – |
| 2021-S Proof Silver Eagle, Type 2* | 199,744 | 199,744 | – | – |
| 2021-S Proof Silver Eagle, Type 2 (Bulk – 40 Coins)* | 652 | 652 | – | – |
| 2021-W Proof Silver Eagle, Type 2* | 300,097 | 300,097 | – | – |
| 2021-W Proof Silver Eagle, Type 2 (Bulk – 40 Coins)* | 2,142 | 2,142 | – | – |
| 2021-W Proof Silver Eagle, Type 1* | 299,898 | 299,898 | – | – |
| 2021-W Proof Silver Eagle, Type 1 (Bulk – 40 Coins)* | 686 | 686 | – | – |
Uncirculated Silver Eagles | ||||
| Old Sales | Latest Sales | Gain/ Loss | % Increase | |
| 2026 (Enhanced Uncirculated) | 124,791 | 124,792 | 1 | 0.00% |
| 2025 | 89,815 | 89,815 | – | – |
| 2025 Bulk 40 | 305 | 305 | – | – |
| 2024 | 130,985 | 130,986 | 1 | 0.00% |
| 2024 Bulk 40 | 500 | 500 | – | – |
| 2023 | 154,014 | 154,017 | 3 | 0.00% |
| 2023 Bulk 40 | 599 | 599 | – | – |
| 2022 | 180,625 | 180,625 | – | – |
| 2022 Bulk 40 | 989 | 989 | – | – |
| 2021* | 174,933 | 174,933 | – | – |
| 2021 Bulk 40* | 324 | 324 | – | – |
2026 Proof American Eagle Gold Coins | ||||
| Old Sales | Latest Sales | Gain/ Loss | % Increase | |
| 1 oz | 9,895 | 9,894 | -1 | -0.01% |
| 1/2 oz | 3,480 | 3,480 | – | – |
| 1/4 oz | 5,977 | 5,980 | 3 | 0.05% |
| 1/10 oz | 13,893 | 13,896 | 3 | 0.02% |
| 4-Coin Set | 6,706 | 6,737 | 31 | 0.46% |
2025 Proof American Eagle Gold Coins | ||||
| Old Sales | Latest Sales | Gain/ Loss | % Increase | |
| 1 oz | 4,117 | 4,124 | 7 | 0.17% |
| 1/2 oz | 1,983 | 1,983 | – | – |
| 1/4 oz | 3,980 | 3,980 | – | – |
| 1/10 oz | 7,973 | 7,973 | – | – |
| 4-Coin Set | 3,038 | 3,040 | 2 | 0.07% |
2024 Proof American Eagle Gold Coins | ||||
| Old Sales | Latest Sales | Gain/ Loss | % Increase | |
| 1 oz | 4,048 | 4,048 | – | – |
| 1/2 oz | 2,491 | 2,503 | 12 | 0.48% |
| 1/4 oz | 5,941 | 5,961 | 20 | 0.34% |
| 1/10 oz | 12,463 | 12,463 | – | – |
| 4-Coin Set | 4,907 | 4,908 | 1 | 0.02% |
2023 Proof American Eagle Gold Coins | ||||
| Old Sales | Latest Sales | Gain/ Loss | % Increase | |
| 1 oz | 6,478 | 6,478 | – | – |
| 1/2 oz | 2,011 | 2,011 | – | – |
| 1/4 oz | 4,493 | 4,493 | – | – |
| 1/10 oz | 13,424 | 13,424 | – | – |
| 4-Coin Set | 9,979 | 9,979 | – | – |
2022 Proof American Eagle Gold Coins | ||||
| Old Sales | Latest Sales | Gain/ Loss | % Increase | |
| 1 oz | 5,913 | 5,913 | – | – |
| 1/2 oz | 1,970 | 1,970 | – | – |
| 1/4 oz | 4,464 | 4,464 | – | – |
| 1/10 oz | 13,806 | 13,806 | – | – |
| 4-Coin Set | 9,906 | 9,906 | – | – |
Uncirculated American Eagle Gold Coins | ||||
| Old Sales | Latest Sales | Gain/ Loss | % Increase | |
| 2026 (Enhanced Uncirculated) | 7,482 | 7,482 | – | – |
| 2025 | 2,805 | 2,809 | 4 | 0.14% |
| 2024 | 3,023 | 3,024 | 1 | 0.03% |
| 2023 | 6,647 | 6,647 | – | – |
| 2022 | 8,900 | 8,900 | – | – |
| 2021* | 9,063 | 9,063 | – | – |
| 2020* | 6,284 | 6,284 | – | – |
| 2019* | 5,851 | 5,851 | – | – |
Proof American Buffalo Gold Coins | ||||
| Old Sales | Latest Sales | Gain/ Loss | % Increase | |
| 2026 Proof Gold Buffalo | 14,736 | 14,736 | – | – |
| 2025 Proof Gold Buffalo | 7,945 | 7,945 | – | – |
| 2024 Proof Gold Buffalo | 10,974 | 10,988 | 14 | 0.13% |
| 2023 Proof Gold Buffalo | 15,911 | 15,911 | – | – |
| 2022 Proof Gold Buffalo | 15,943 | 15,943 | – | – |
| 2021 Proof Gold Buffalo* | 16,976 | 16,976 | – | – |
| 2020 Proof Gold Buffalo* | 11,887 | 11,887 | – | – |
| 2019 Proof Gold Buffalo* | 14,844 | 14,844 | – | – |
Proof American Platinum Eagle | ||||
| Old Sales | Latest Sales | Gain/ Loss | % Increase | |
| 2026 | 6,600 | 6,620 | 20 | 0.30% |
| 2025* | 6,474 | 6,474 | – | – |
| 2024 | 9,599 | 9,599 | – | – |
| 2023 | 9,355 | 9,357 | 2 | 0.02% |
| 2022* | 9,941 | 9,941 | – | – |
| 2021* | 9,884 | 9,884 | – | – |
| 2020* | 9,837 | 9,837 | – | – |
| 2019* | 11,268 | 11,268 | – | – |
| 2018* | 19,180 | 19,180 | – | – |
| 2017* | 8,890 | 8,890 | – | – |
American Palladium Eagle | ||||
| Old Sales | Latest Sales | Gain/ Loss | % Increase | |
| 1776 ~ 2026-W Uncirculated American Palladium Eagle | 4,989 | 4,992 | 3 | 0.06% |
| 2025-W Reverse Proof | 3,991 | 3,991 | – | – |
| 2024-W Proof | 5,961 | 5,961 | – | – |
| 2023-W Uncirculated | 5,784 | 5,784 | – | – |
| 2022-W Reverse Proof | 7,439 | 7,439 | – | – |
| 2021-W Proof | 5,170 | 5,170 | – | – |
| 2020-W Uncirculated | 9,746 | 9,746 | – | – |
| 2019-W Reverse Proof | 18,839 | 18,839 | – | – |
| 2018-W Proof* | 14,986 | 14,986 | – | – |
Presidential Silver Medals | ||||
| Old Sales | Latest Sales | Gain/ Loss | % Increase | |
| (2026) Calvin Coolidge Presidential Silver Medal | 8,228 | 8,246 | 18 | 0.22% |
| (2026) Warren G. Harding Presidential Silver Medal | 8,732 | 8,735 | 3 | 0.03% |
| (2026) Woodrow Wilson Presidential Silver Medal | 9,136 | 9,137 | 1 | 0.01% |
| (2025) William H. Taft Presidential Silver Medal | 10,480 | 10,481 | 1 | 0.01% |
| (2025) Theodore Roosevelt Presidential Silver Medal | 13,074 | 13,077 | 3 | 0.02% |
| (2025) William McKinley Presidential Silver Medal | 10,775 | 10,777 | 2 | 0.02% |
| (2025) Benjamin Harrison Presidential Silver Medal | 10,715 | 10,717 | 2 | 0.02% |
| (2024) Grover Cleveland Presidential Silver Medal | 11,995 | 11,999 | 4 | 0.03% |
| (2024) Chester A. Arthur Presidential Silver Medal | 11,486 | 11,487 | 1 | 0.01% |
| (2024) James A. Garfield Presidential Silver Medal | 12,201 | 12,202 | 1 | 0.01% |
| (2024) Rutherford B. Hayes Presidential Silver Medal | 12,276 | 12,277 | 1 | 0.01% |
| (2023) Ulysses S. Grant Presidential Silver Medal | 15,087 | 15,092 | 5 | 0.03% |
| (2023) Andrew Johnson Presidential Silver Medal | 13,163 | 13,166 | 3 | 0.02% |
| (2023) Abraham Lincoln Presidential Silver Medal | 23,209 | 23,214 | 5 | 0.02% |
| (2023) James Buchanan Presidential Silver Medal | 12,971 | 12,971 | – | – |
| (2021) Franklin Pierce Presidential Silver Medal | 13,186 | 13,187 | 1 | 0.01% |
| (2022) Millard Fillmore Presidential Silver Medal | 13,236 | 13,237 | 1 | 0.01% |
| (2022) Zachary Taylor Presidential Silver Medal | 13,640 | 13,641 | 1 | 0.01% |
| (2022) James Knox Polk Presidential Silver Medal | 13,946 | 13,946 | – | – |
| (2021) John Tyler Presidential Silver Medal | 14,276 | 14,277 | 1 | 0.01% |
| (2021) William Henry Harrison Presidential Silver Medal | 14,268 | 14,269 | 1 | 0.01% |
| (2021) Martin Van Buren Presidential Silver Medal | 14,430 | 14,431 | 1 | 0.01% |
| (2020) Andrew Jackson Presidential Silver Medal | 17,949 | 17,949 | – | – |
| (2019) John Quincy Adams Presidential Silver Medal | 15,554 | 15,554 | – | – |
| (2019) James Monroe Presidential Silver Medal | 16,043 | 16,044 | 1 | 0.01% |
| (2019) James Madison Presidential Silver Medal | 17,862 | 17,863 | 1 | 0.01% |
| (2019) Thomas Jefferson Presidential Silver Medal | 26,554 | 26,556 | 2 | 0.01% |
| (2018) George Washington Presidential Silver Medal | 39,734 | 39,735 | 1 | 0.00% |
| (2018) John Adams Presidential Silver Medal | 24,678 | 24,679 | 1 | 0.00% |
American Innovation Reverse Proof Sets | ||||
| Old Sales | Latest Sales | Gain/ Loss | % Increase | |
| 2026 | 49,268 | 50,141 | 873 | 1.77% |
| 2025 | 42,641 | 42,723 | 82 | 0.19% |
| 2024 | 36,213 | 36,228 | 15 | 0.04% |
| 2023 | 44,543 | 44,576 | 33 | 0.07% |
| 2022* | 49,851 | 49,851 | – | – |
| 2021* | 49,813 | 49,813 | – | – |
2026 American Innovation Dollars – Minnesota | ||||
| Old Sales | Latest Sales | Gain/ Loss | % Increase | |
| 25-coin roll set (P) | 8,362 | 8,363 | 1 | 0.01% |
| 25-coin roll set (D) | 7,334 | 7,333 | -1 | -0.01% |
| 100-coin bag (P) | 3,136 | 3,137 | 1 | 0.03% |
| 100-coin bag (D) | 2,941 | 2,942 | 1 | 0.03% |
2026 American Innovation Dollars – California | ||||
| Old Sales | Latest Sales | Gain/ Loss | % Increase | |
| 25-coin roll set (P) | 9,556 | 9,556 | – | – |
| 25-coin roll set (D) | 8,513 | 8,513 | – | – |
| 100-coin bag (P) | 3,946 | 3,946 | – | – |
| 100-coin bag (D) | 3,734 | 3,734 | – | – |
2026 American Innovation Dollars – Wisconsin | ||||
| Old Sales | Latest Sales | Gain/ Loss | % Increase | |
| 25-coin roll set (P) | 8,377 | 8,378 | 1 | 0.01% |
| 25-coin roll set (D) | 7,329 | 7,329 | – | – |
| 100-coin bag (P) | 3,137 | 3,137 | – | – |
| 100-coin bag (D) | 2,933 | 2,933 | – | – |
2026 American Innovation Dollars – Iowa | ||||
| Old Sales | Latest Sales | Gain/ Loss | % Increase | |
| 25-coin roll set (P) | 8,391 | 8,391 | – | – |
| 25-coin roll set (D) | 7,290 | 7,290 | – | – |
| 100-coin bag (P) | 3,147 | 3,148 | 1 | 0.03% |
| 100-coin bag (D) | 2,946 | 2,946 | – | – |
2025 American Innovation Dollars – Texas | ||||
| Old Sales | Latest Sales | Gain/ Loss | % Increase | |
| 25-coin roll set (P) | 9,093 | 9,093 | – | – |
| 25-coin roll set (D) | 8,048 | 8,048 | – | – |
| 100-coin bag (P) | 3,638 | 3,638 | – | – |
| 100-coin bag (D) | 3,444 | 3,444 | – | – |
2025 American Innovation Dollars – Florida | ||||
| Old Sales | Latest Sales | Gain/ Loss | % Increase | |
| 25-coin roll set (P) | 9,081 | 9,081 | – | – |
| 25-coin roll set (D) | 8,039 | 8,039 | – | – |
| 100-coin bag (P) | 3,637 | 3,637 | – | – |
| 100-coin bag (D) | 3,442 | 3,442 | – | – |
2025 American Innovation Dollars – Michigan | ||||
| Old Sales | Latest Sales | Gain/ Loss | % Increase | |
| 25-coin roll set (P) | 8,882 | 8,882 | – | – |
| 25-coin roll set (D) | 7,839 | 7,839 | – | – |
| 100-coin bag (P) | 3,645 | 3,645 | – | – |
| 100-coin bag (D) | 3,444 | 3,444 | – | – |
2025 American Innovation Dollars – Arkansas | ||||
| Old Sales | Latest Sales | Gain/ Loss | % Increase | |
| 25-coin roll set (P) | 8,280 | 8,280 | – | – |
| 25-coin roll set (D) | 7,336 | 7,336 | – | – |
| 100-coin bag (P) | 3,140 | 3,140 | – | – |
| 100-coin bag (D) | 2,943 | 2,943 | – | – |
2024 American Innovation Dollars – Missouri | ||||
| Old Sales | Latest Sales | Gain/ Loss | % Increase | |
| 25-coin roll set (P) | 8,381 | 8,381 | – | – |
| 25-coin roll set (D) | 7,343 | 7,343 | – | – |
| 100-coin bag (P) | 3,148 | 3,148 | – | – |
| 100-coin bag (D) | 2,926 | 2,926 | – | – |
2024 American Innovation Dollars – Maine | ||||
| Old Sales | Latest Sales | Gain/ Loss | % Increase | |
| 25-coin roll set (P) | 8,221 | 8,221 | – | – |
| 25-coin roll set (D) | 7,340 | 7,340 | – | – |
| 100-coin bag (P) | 3,234 | 3,234 | – | – |
| 100-coin bag (D) | 2,806 | 2,848 | 42 | 1.50% |
2024 American Innovation Dollars – Alabama | ||||
| Old Sales | Latest Sales | Gain/ Loss | % Increase | |
| 25-coin roll set (P) | 8,394 | 8,394 | – | – |
| 25-coin roll set (D) | 7,443 | 7,443 | – | – |
| 100-coin bag (P) | 3,149 | 3,149 | – | – |
| 100-coin bag (D) | 2,950 | 2,950 | – | – |
2024 American Innovation Dollars – Illinois | ||||
| Old Sales | Latest Sales | Gain/ Loss | % Increase | |
| 25-coin roll set (P) | 8,335 | 8,335 | – | – |
| 25-coin roll set (D) | 7,332 | 7,332 | – | – |
| 100-coin bag (P) | 3,156 | 3,156 | – | – |
| 100-coin bag (D) | 2,941 | 2,941 | – | – |
2023 American Innovation Dollars – Mississippi | ||||
| Old Sales | Latest Sales | Gain/ Loss | % Increase | |
| 25-coin roll set (P) | 7,953 | 7,953 | – | – |
| 25-coin roll set (D) | 6,964 | 6,964 | – | – |
| 100-coin bag (P) | 2,984 | 2,984 | – | – |
| 100-coin bag (D) | 2,778 | 2,778 | – | – |
2023 American Innovation Dollars – Indiana | ||||
| Old Sales | Latest Sales | Gain/ Loss | % Increase | |
| 25-coin roll set (P) | 8,022 | 8,022 | – | – |
| 25-coin roll set (D) | 6,994 | 6,994 | – | – |
| 100-coin bag (P) | 3,013 | 3,013 | – | – |
| 100-coin bag (D) | 2,801 | 2,801 | – | – |
2023 American Innovation Dollars – Louisiana | ||||
| Old Sales | Latest Sales | Gain/ Loss | % Increase | |
| 25-coin roll set (P) | 7,993 | 7,993 | – | – |
| 25-coin roll set (D) | 6,990 | 6,990 | – | – |
| 100-coin bag (P) | 2,978 | 2,978 | – | – |
| 100-coin bag (D) | 2,760 | 2,760 | – | – |
2023 American Innovation Dollars – Ohio | ||||
| Old Sales | Latest Sales | Gain/ Loss | % Increase | |
| 25-coin roll set (P) | 8,016 | 8,016 | – | – |
| 25-coin roll set (D) | 6,978 | 6,978 | – | – |
| 100-coin bag (P) | 2,983 | 2,983 | – | – |
| 100-coin bag (D) | 2,762 | 2,762 | – | – |
2022 American Innovation Dollars – Tennessee | ||||
| Old Sales | Latest Sales | Gain/ Loss | % Increase | |
| 25-coin roll set (P) | 7,014 | 7,014 | – | – |
| 25-coin roll set (D) | 7,010 | 7,010 | – | – |
| 100-coin bag (P) | 2,786 | 2,786 | – | – |
| 100-coin bag (D) | 2,786 | 2,786 | – | – |
2022 American Innovation Dollars – Kentucky | ||||
| Old Sales | Latest Sales | Gain/ Loss | % Increase | |
| 25-coin roll set (P) | 7,009 | 7,009 | – | – |
| 25-coin roll set (D) | 7,005 | 7,005 | – | – |
| 100-coin bag (P) | 2,771 | 2,771 | – | – |
| 100-coin bag (D) | 2,780 | 2,780 | – | – |
2022 American Innovation Dollars – Vermont | ||||
| Old Sales | Latest Sales | Gain/ Loss | % Increase | |
| 25-coin roll set (P) | 7,023 | 7,023 | – | – |
| 25-coin roll set (D) | 7,011 | 7,011 | – | – |
| 100-coin bag (P) | 2,787 | 2,787 | – | – |
| 100-coin bag (D) | 2,784 | 2,784 | – | – |
2022 American Innovation Dollars – Rhode Island | ||||
| Old Sales | Latest Sales | Gain/ Loss | % Increase | |
| 25-coin roll set (P) | 7,010 | 7,010 | – | – |
| 25-coin roll set (D) | 7,007 | 7,007 | – | – |
| 100-coin bag (P) | 2,789 | 2,789 | – | – |
| 100-coin bag (D) | 2,787 | 2,787 | – | – |
2021 American Innovation Dollars – North Carolina | ||||
| Old Sales | Latest Sales | Gain/ Loss | % Increase | |
| 25-coin roll set (P) | 7,010 | 7,010 | – | – |
| 25-coin roll set (D) | 7,018 | 7,018 | – | – |
| 100-coin bag (P) | 2,789 | 2,789 | – | – |
| 100-coin bag (D) | 2,790 | 2,790 | – | – |
2021 American Innovation Dollars – New York | ||||
| Old Sales | Latest Sales | Gain/ Loss | % Increase | |
| 25-coin roll set (P) | 7,006 | 7,006 | – | – |
| 25-coin roll set (D) | 7,013 | 7,013 | – | – |
| 100-coin bag (P) | 2,786 | 2,786 | – | – |
| 100-coin bag (D) | 2,785 | 2,785 | – | – |
2021 American Innovation Dollars – Virginia | ||||
| Old Sales | Latest Sales | Gain/ Loss | % Increase | |
| 25-coin roll set (P) | 7,015 | 7,015 | – | – |
| 25-coin roll set (D) | 7,010 | 7,010 | – | – |
| 100-coin bag (P) | 2,796 | 2,796 | – | – |
| 100-coin bag (D) | 2,786 | 2,786 | – | – |
2021 American Innovation Dollars – New Hampshire | ||||
| Old Sales | Latest Sales | Gain/ Loss | % Increase | |
| 25-coin roll set (P) | 7,017 | 7,017 | – | – |
| 25-coin roll set (D) | 7,017 | 7,017 | – | – |
| 100-coin bag (P) | 2,789 | 2,789 | – | – |
| 100-coin bag (D) | 2,790 | 2,790 | – | – |
2020 American Innovation Dollars – South Carolina | ||||
| Old Sales | Latest Sales | Gain/ Loss | % Increase | |
| Reverse Proof (S) | 45,271 | 45,285 | 14 | 0.03% |
| 25-coin roll set (P) | 6,378 | 6,378 | – | – |
| 25-coin roll set (D) | 6,399 | 6,399 | – | – |
| 100-coin bag (P) | 2,734 | 2,734 | – | – |
| 100-coin bag (D) | 2,378 | 2,378 | – | – |
2020 American Innovation Dollars – Maryland | ||||
| Old Sales | Latest Sales | Gain/ Loss | % Increase | |
| Reverse Proof (S) | 49,852 | 49,852 | – | – |
| 25-coin roll set (P) | 6,493 | 6,493 | – | – |
| 25-coin roll set (D) | 6,471 | 6,471 | – | – |
| 100-coin bag (P) | 2,725 | 2,725 | – | – |
| 100-coin bag (D) | 2,737 | 2,737 | – | – |
2020 American Innovation Dollars – Massachusetts | ||||
| Old Sales | Latest Sales | Gain/ Loss | % Increase | |
| Reverse Proof (S) | 49,785 | 49,785 | – | – |
| 25-coin roll set (P) | 6,486 | 6,486 | – | – |
| 25-coin roll set (D) | 6,481 | 6,481 | – | – |
| 100-coin bag (P) | 2,746 | 2,746 | – | – |
| 100-coin bag (D) | 2,744 | 2,744 | – | – |
2020 American Innovation Dollars – Connecticut | ||||
| Old Sales | Latest Sales | Gain/ Loss | % Increase | |
| Reverse Proof (S) | 49,001 | 49,014 | 13 | 0.03% |
| 25-coin roll set (P) | 6,496 | 6,496 | – | – |
| 25-coin roll set (D) | 6,425 | 6,425 | – | – |
| 100-coin bag (P) | 2,736 | 2,736 | – | – |
| 100-coin bag (D) | 2,747 | 2,747 | – | – |
2019 American Innovation Dollars – Georgia | ||||
| Old Sales | Latest Sales | Gain/ Loss | % Increase | |
| Reverse Proof (S) | 49,152 | 49,166 | 14 | 0.03% |
| 25-coin roll set (P) | 8,094 | 8,094 | – | – |
| 25-coin roll set (D) | 7,542 | 7,542 | – | – |
| 100-coin bag (P) | 3,459 | 3,459 | – | – |
| 100-coin bag (D) | 3,968 | 3,968 | – | – |
2019 American Innovation Dollars – New Jersey | ||||
| Old Sales | Latest Sales | Gain/ Loss | % Increase | |
| Reverse Proof (S) | 54,258 | 54,271 | 13 | 0.02% |
| 25-coin roll set (P) | 9,103 | 9,103 | – | – |
| 25-coin roll set (D) | 8,043 | 8,043 | – | – |
| 100-coin bag (P) | 3,941 | 3,941 | – | – |
| 100-coin bag (D) | 3,586 | 3,586 | – | – |
2019 American Innovation Dollars – Pennsylvania | ||||
| Old Sales | Latest Sales | Gain/ Loss | % Increase | |
| Reverse Proof (S) | 57,880 | 57,898 | 18 | 0.03% |
| 25-coin roll set (P) | 10,458 | 10,458 | – | – |
| 25-coin roll set (D) | 8,536 | 8,536 | – | – |
| 100-coin bag (P) | 3,689 | 3,689 | – | – |
| 100-coin bag (D) | 3,055 | 3,055 | – | – |
2019 American Innovation Dollars – Delaware | ||||
| Old Sales | Latest Sales | Gain/ Loss | % Increase | |
| Reverse Proof (S) | 72,650 | 72,660 | 10 | 0.01% |
| 25-coin roll set (P) | 9,112 | 9,112 | – | – |
| 25-coin roll set (D) | 8,372 | 8,372 | – | – |
| 100-coin bag (P) | 3,203 | 3,203 | – | – |
| 100-coin bag (D) | 3,385 | 3,385 | – | – |
2018 American Innovation Dollars | ||||
| Old Sales | Latest Sales | Gain/ Loss | % Increase | |
| Reverse Proof (S)* | 74,720 | 74,720 | – | – |
| Proof Coin (S) | 255,441 | 255,441 | – | – |
| 25-coin roll set (P) | 22,902 | 22,902 | – | – |
| 25-coin roll set (D) | 25,725 | 25,725 | – | – |
| 100-coin bag (P)* | 2,935 | 2,935 | – | – |
| 100-coin bag (D)* | 2,954 | 2,954 | – | – |
George H.W. Bush Coin & Chronicles Set | ||||
| Old Sales | Latest Sales | Gain/ Loss | % Increase | |
| $1 Coin & Set | 11,549 | 11,549 | – | – |
2020 Bush Presidential $1 Coin & First Spouse Medal Set | ||||
| Old Sales | Latest Sales | Gain/ Loss | % Increase | |
| $1 Coin & Set | 9,876 | 9,876 | – | – |
2020 George H.W. Bush Presidential $1 Coins | ||||
| Old Sales | Latest Sales | Gain/ Loss | % Increase | |
| 25-coin roll (P) | 24,926 | 24,926 | – | – |
| 25-coin roll (D) | 24,854 | 24,854 | – | – |
| 100-coin bag (P) | 2,695 | 2,695 | – | – |
| 100-coin bag (D) | 2,098 | 2,098 | – | – |
| 250-coin bag (P) | 5,107 | 5,110 | 3 | 0.06% |
| 250-coin bag (D) | 6,348 | 6,349 | 1 | 0.02% |
Native American Dollar Rolls | ||||
| Old Sales | Latest Sales | Gain/ Loss | % Increase | |
| 2026-P Native American $1 25 Coin Roll | 14,665 | 14,665 | – | – |
| 2026-D Native American $1 25 Coin Roll | 14,413 | 14,413 | – | – |
| 2026-P Native American $1 100-Coin Bag | 1,795 | 1,795 | – | – |
| 2026-D Native American $1 100-Coin Bag | 1,796 | 1,796 | – | – |
| 2025-P Native American $1 25 Coin Roll | 13,515 | 13,558 | 43 | 0.32% |
| 2025-D Native American $1 25 Coin Roll | 12,930 | 12,963 | 33 | 0.26% |
| 2025-P Native American $1 100-Coin Bag | 1,793 | 1,793 | – | – |
| 2025-D Native American $1 100-Coin Bag | 1,796 | 1,796 | – | – |
| 2025-P Native American $1 250-Coin Box | 1,188 | 1,193 | 5 | 0.42% |
| 2025-D Native American $1 250-Coin Box | 1,226 | 1,230 | 4 | 0.33% |
| 2024-P Native American $1 25 Coin Roll* | 14,686 | 14,686 | – | – |
| 2024-D Native American $1 25 Coin Roll* | 14,679 | 14,679 | – | – |
| 2024-P Native American $1 100-Coin Bag* | 1,746 | 1,746 | – | – |
| 2024-D Native American $1 100-Coin Bag* | 1,795 | 1,795 | – | – |
| 2024-P Native American $1 250-Coin Box* | 1,784 | 1,784 | – | – |
| 2024-D Native American $1 250-Coin Box* | 1,692 | 1,692 | – | – |
| 2023-P Native American $1 25 Coin Roll* | 13,922 | 13,922 | – | – |
| 2023-D Native American $1 25 Coin Roll* | 13,954 | 13,954 | – | – |
| 2023-P Native American $1 100-Coin Bag* | 1,695 | 1,695 | – | – |
| 2023-D Native American $1 100-Coin Bag* | 1,694 | 1,694 | – | – |
| 2023-P Native American $1 250-Coin Box* | 1,698 | 1,698 | – | – |
| 2023-D Native American $1 250-Coin Box* | 1,618 | 1,618 | – | – |
| 2022-P Native American $1 25 Coin Roll* | 13,996 | 13,996 | – | – |
| 2022-D Native American $1 25 Coin Roll* | 13,965 | 13,965 | – | – |
| 2022-P Native American $1 100-Coin Bag* | 1,699 | 1,699 | – | – |
| 2022-D Native American $1 100-Coin Bag* | 1,614 | 1,614 | – | – |
| 2022-P Native American $1 250-Coin Box* | 1,698 | 1,698 | – | – |
| 2022-D Native American $1 250-Coin Box* | 1,699 | 1,699 | – | – |
2026 Semiquincentennial Enduring Liberty Half Dollars | ||||
| Old Sales | Latest Sales | Gain/ Loss | % Increase | |
| 9/11 20-Coin Roll (P) | 47,724 | 47,698 | -26 | -0.05% |
| 9/11 100-Coin Bag (P) | 26,417 | 26,403 | -14 | -0.05% |
| Two-Roll Set | 99,755 | 99,764 | 9 | 0.01% |
| 200-Coin Bag (P&D) | 48,655 | 49,420 | 765 | 1.57% |
Kennedy Half Dollar Rolls | ||||
| Old Sales | Latest Sales | Gain/ Loss | % Increase | |
| 2025-dated 200-coin bag (P&D)* | 11,521 | 11,521 | – | – |
| 2025-dated 2-roll set (P&D)* | 26,199 | 26,199 | – | – |
| 2024-dated 200-coin bag (P&D)* | 11,451 | 11,451 | – | – |
| 2024-dated 2-roll set (P&D)* | 26,261 | 26,261 | – | – |
| 2023-dated 200-coin bag (P&D)* | 11,170 | 11,170 | – | – |
| 2023-dated 2-roll set (P&D)* | 24,987 | 24,987 | – | – |
| 2022-dated 200-coin bag (P&D)* | 10,999 | 10,999 | – | – |
| 2022-dated 2-roll set (P&D)* | 21,926 | 21,926 | – | – |
| 2021-dated 200-coin bag (P&D)* | 9,976 | 9,976 | – | – |
| 2021-dated 2-roll set (P&D)* | 21,989 | 21,989 | – | – |
| 2020-dated 200-coin bag (P&D)* | 11,776 | 11,776 | – | – |
| 2020-dated 2-roll set (P&D)* | 24,312 | 24,312 | – | – |
| 2019-dated 200-coin bag (P&D)* | 11,534 | 11,534 | – | – |
| 2019-dated 2-roll set (P&D)* | 24,132 | 24,132 | – | – |
2026 Semiquincentennial Gettysburg Address Quarters | ||||
| Old Sales | Latest Sales | Gain/ Loss | % Increase | |
| 100-Coin Bag (P) | – | 5,715 | – | – |
| 100-Coin Bag (D) | – | 5,646 | – | – |
| Two-Roll Set | – | 8,718 | – | – |
2026 Semiquincentennial U.S. Constitution Quarters | ||||
| Old Sales | Latest Sales | Gain/ Loss | % Increase | |
| 100-Coin Bag (P) | 6,191 | 6,189 | -2 | -0.03% |
| 100-Coin Bag (D) | 6,184 | 6,181 | -3 | -0.05% |
| Two-Roll Set | 10,390 | 10,392 | 2 | 0.02% |
2026 Semiquincentennial Declaration of Independence Quarters | ||||
| Old Sales | Latest Sales | Gain/ Loss | % Increase | |
| 100-Coin Bag (P) | 6,191 | 6,191 | – | – |
| 100-Coin Bag (D) | 6,192 | 6,192 | – | – |
| Two-Roll Set | 10,387 | 10,386 | -1 | -0.01% |
2026 Semiquincentennial Revolutionary War Quarters | ||||
| Old Sales | Latest Sales | Gain/ Loss | % Increase | |
| 100-Coin Bag (P) | 9,194 | 9,194 | – | – |
| 100-Coin Bag (D) | 6,198 | 6,198 | – | – |
| Two-Roll Set | 10,904 | 10,904 | – | – |
2026 Semiquincentennial Mayflower Compact Quarters | ||||
| Old Sales | Latest Sales | Gain/ Loss | % Increase | |
| 100-Coin Bag (P) | 6,184 | 6,184 | – | – |
| 100-Coin Bag (D) | 6,161 | 6,161 | – | – |
| Two-Roll Set | 10,337 | 10,347 | 10 | 0.10% |
2025 Althea Gibson Quarters | ||||
| Old Sales | Latest Sales | Gain/ Loss | % Increase | |
| Three-Roll Set | 9,806 | 9,806 | – | – |
| 100-Coin Bag (P) | 1,454 | 1,454 | – | – |
| 100-Coin Bag (D) | 967 | 967 | – | – |
| Two-Roll Set | 2,123 | 2,123 | – | – |
2025 Stacey Park Milbern Quarters | ||||
| Old Sales | Latest Sales | Gain/ Loss | % Increase | |
| Three-Roll Set | 9,397 | 9,397 | – | – |
| 100-Coin Bag (P) | 1,435 | 1,435 | – | – |
| 100-Coin Bag (D) | 960 | 960 | – | – |
| Two-Roll Set | 2,109 | 2,109 | – | – |
2025 Dr. Vera Rubin Quarters | ||||
| Old Sales | Latest Sales | Gain/ Loss | % Increase | |
| Three-Roll Set | 9,918 | 9,918 | – | – |
| 100-Coin Bag (P) | 1,667 | 1,667 | – | – |
| 100-Coin Bag (D) | 1,060 | 1,060 | – | – |
| Two-Roll Set | 2,231 | 2,231 | – | – |
2025 Juliette Gordon Low Quarters | ||||
| Old Sales | Latest Sales | Gain/ Loss | % Increase | |
| Three-Roll Set | 11,170 | 11,170 | – | – |
| 100-Coin Bag (P) | 3,290 | 3,290 | – | – |
| 100-Coin Bag (D) | 1,890 | 1,890 | – | – |
| Two-Roll Set | 3,836 | 3,836 | – | – |
2025 Ida B. Wells Quarters | ||||
| Old Sales | Latest Sales | Gain/ Loss | % Increase | |
| Three-Roll Set | 10,651 | 10,651 | – | – |
| 100-Coin Bag (P) | 2,075 | 2,075 | – | – |
| 100-Coin Bag (D) | 1,231 | 1,231 | – | – |
| Two-Roll Set | 2,532 | 2,532 | – | – |
2026 Semiquincentennial Dimes | ||||
| Old Sales | Latest Sales | Gain/ Loss | % Increase | |
| 200-Coin Bag (P & D) | 11,098 | 11,098 | – | – |
| Two-Roll Set | 12,063 | 12,063 | – | – |