The U.S. Mint’s Liberty Bell-shaped Freedom Ringing collectibles appeared in the agency’s sales data for the first time following their July 16 launch. The 1776 ~ 2026 half-ounce silver medal led the trio with 2,021 sold, representing 99.8% of its 2,026-piece mintage limit. Priced at $750, the medal became unavailable within one minute of launch and is commanding exceptional premiums in the secondary market.
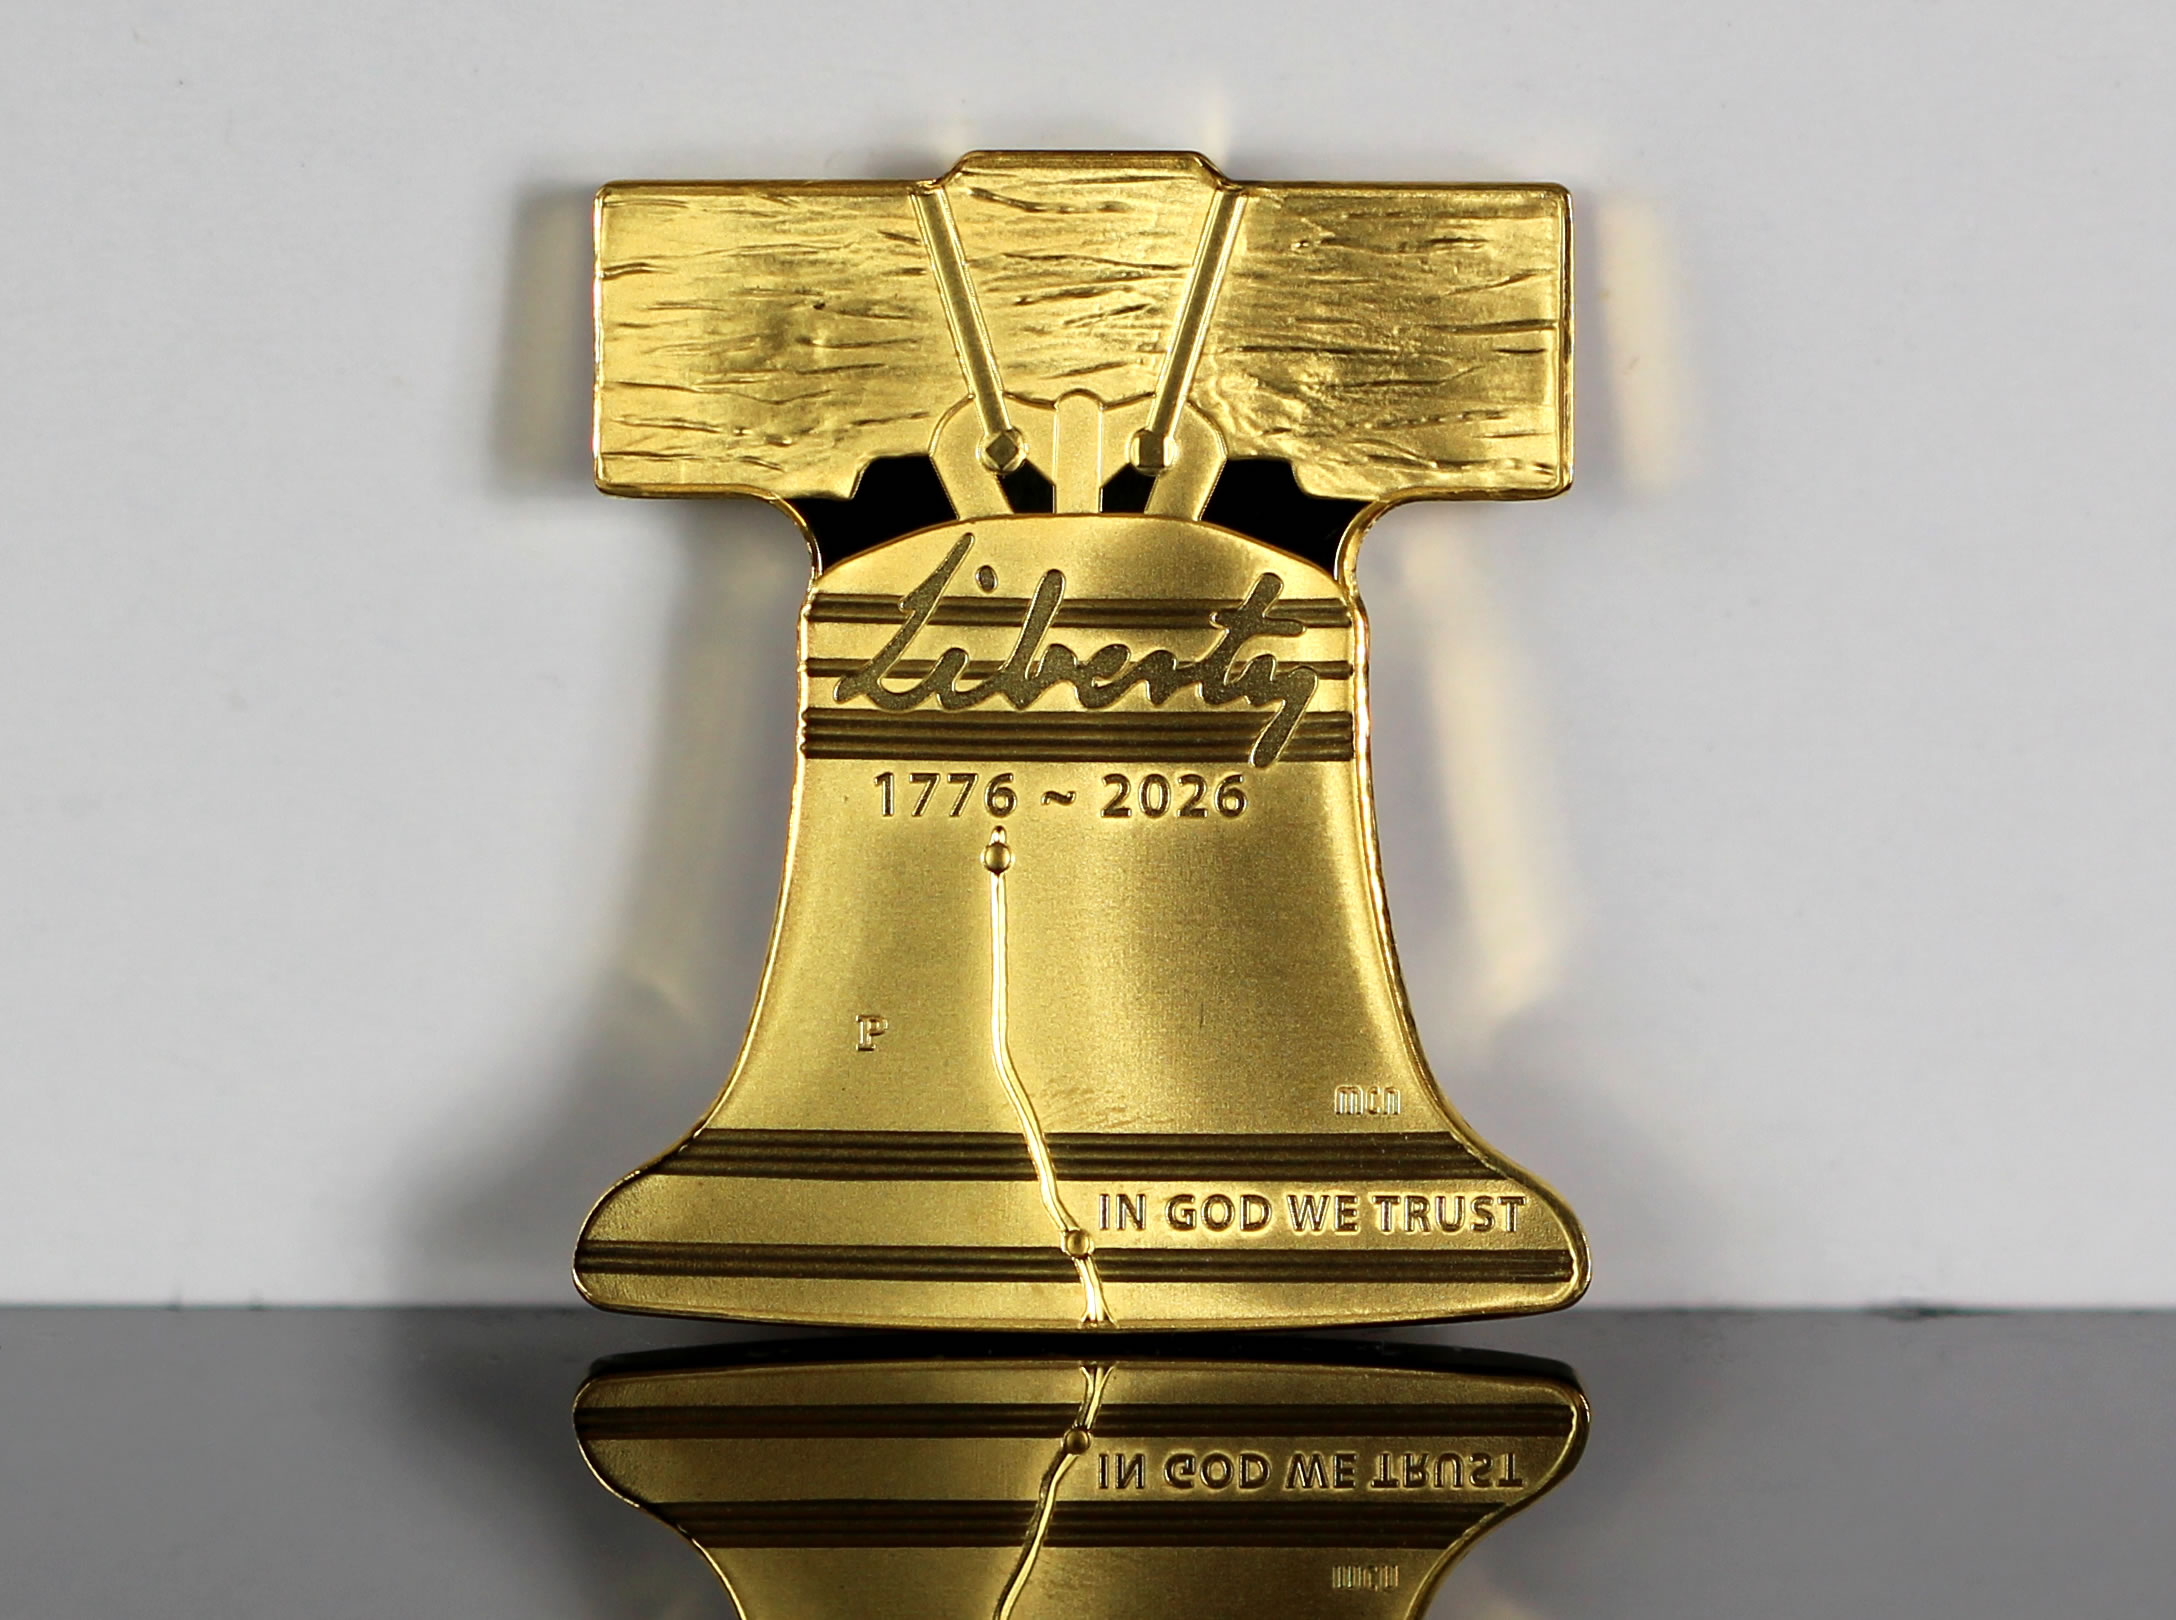
Both Freedom Ringing gold coins became unavailable within 30 minutes of release, initially suggesting sellouts and fueling early aftermarket demand. They later returned to sale and have remained available for several days. The $10,050 half-ounce gold coin opened at 1,622 sold, or 80.1% of its limit, while the $19,600 one-ounce gold coin reached 1,428 sold, or 70.5%.
Given their premium prices and sustained availability despite low mintages, both could remain on sale for some time.
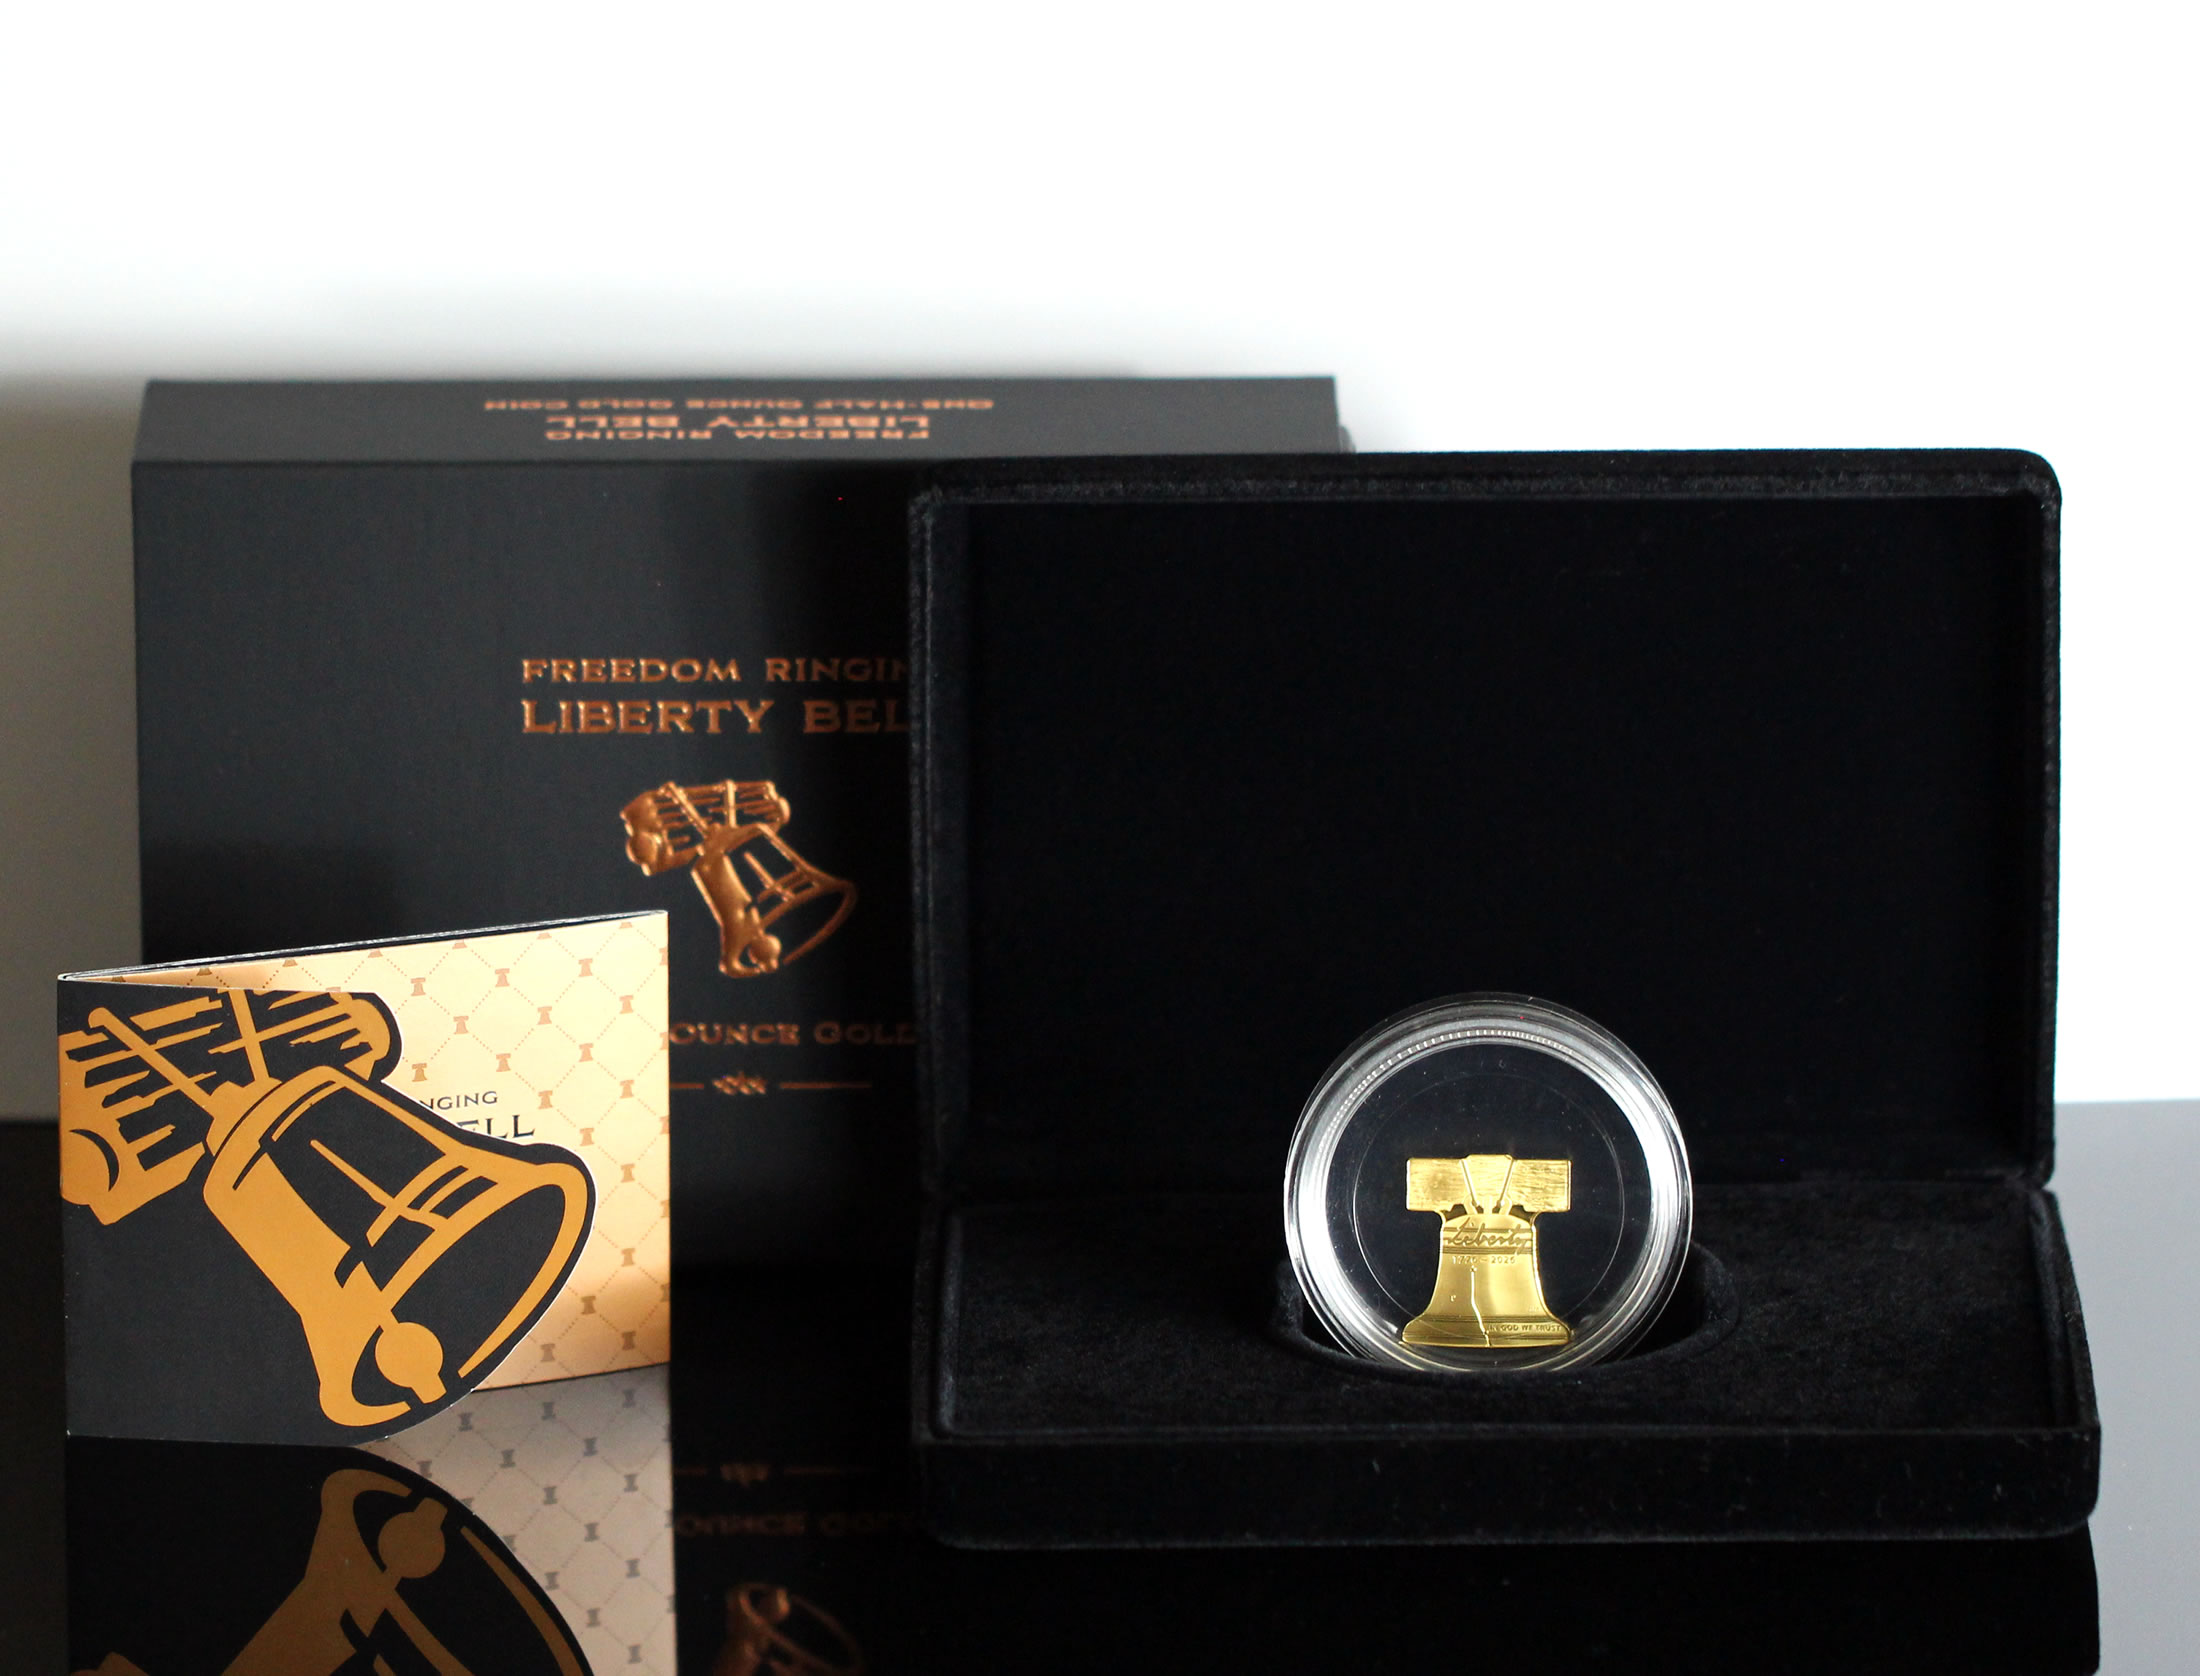
Returns will also appear in the coming weeks as buyers reassess their costly purchases after seeing the coins in hand. Packaging concerns have already surfaced. Some collectors have reported that their coins arrived off-center and slide freely within oversized round capsules, undermining the polished presentation expected from any U.S. Mint collectible, let alone one priced from $10,000 to nearly $20,000.
Overall, the silver medal, one-ounce gold coin and half-ounce gold coin ranked fifth, sixth and seventh, respectively, among the Mint’s top weekly sellers.
Early Pre-Launch Sales for the 1776 ~ 2026-W Enhanced Uncirculated American Silver Eagle
Meanwhile, sales kicked of Tuesday for the 2026-W Enhanced Uncirculated American Silver Eagle. It lasted 3 minutes before becoming unavailable.
Mint sales reports often include figures for products shortly before their official release, reflecting advance orders through programs such as subscriptions. In this case, pre-release sales for the silver coin totaled 88,515, representing 70.8% of the 125,000 mintage limit.
The coin carries the dual date 1776 ~ 2026 and a Liberty Bell "250" privy mark. It is only the second American Silver Eagle issued with the enhanced uncirculated finish, following the 2013 release, and the first to pair it with the current eagle-landing reverse introduced in 2021.
U.S. Mint Top Weekly Sellers
Below is a list of the U.S. Mint’s best-selling numismatic products for the week ending July 19.
- 2026-W Proof Silver Eagle (+4,658 to 403,816)
- 2026 P&D Enduring Liberty Half Dollars Two-Roll Sets (+4,539 to 97,635)
- 2026-P Reverse Proof Morgan Silver Dollar (+4,366 to 163,013)
- 2026-P Reverse Proof Peace Silver Dollar (+3,501 to 148,596)
- 2026 Freedom Ringing Liberty Bell 1/2 Ounce Silver Medal (+2,021)
- 2026 $125 Freedom Ringing 1/2-Ounce Gold Coin (+1,622)
- 2026 $250 Freedom Ringing Liberty Bell 1-Ounce Gold Coin (+1,428)
- 2026-P Proof FIFA World Cup Silver Dollar (+1,132 to 17,285)
- 2026 P&D Enduring Liberty Half Dollars 200-Coin Bags (+1,028 to 38,042)
- 2025-P 250th Anniversary U.S. Marine Corps Proof Silver Eagle (+1,010 to 99,749)
In its latest report, the Mint published sales data for 676 numismatic products. Aside from the new Freedom Ringing coins and medal, 7 products gained more than 1,000 units compared with 5 in the previous report.
Sales momentum surged, with 98 products outpacing their prior weekly gains, up from 55 in the previous report. Earlier totals were 86, 78, 82, 66, 43, 82, 57, 70, 95, 67 and 39.
Products Posting Declines
Nine products registered week-over-week declines, down from 13 in the prior reporting period. Most were modest. The declines were:
- 2026-W $50 American Gold Buffalo Proof Coin — down 2 to 14,678
- 2026-P Revolutionary War Quarters in 100-Coin Bags — down 2 to 9,191
- 2026-P Wisconsin American Innovation 25-Coin Rolls — down 2 to 8,360
- 2026-D Wisconsin American Innovation 25-Coin Rolls — down 2 to 7,316
- 2026 P&D Mayflower Compact Quarters Two-Roll Sets — down 10 to 10,327
- 2026 Emerging Liberty Dime 200-Coin Bag — down 13 to 10,967
- 1916 Mercury Dime Gold Coin and Silver Medal Set — down 47 to 28,549
- 2026 Silver Proof Set — down 1,116 to 254,106
- 2026 Mint Set — down 2,564 to 292,248
US Mint Sales: Numismatic Products
Below are tables showing the latest available sales for U.S. Mint numismatic products. The sales period covers July 13 through July 19. Products with an asterisk (*) are no longer available or had no reported sales.
2026 Commemorative Coins | ||||
| Old Sales | Latest Sales | Gain/ Loss | % Increase | |
| 2026-P Uncirculated FIFA World Cup Half Dollar | 5,347 | 5,688 | 341 | 6.38% |
| 2026-P Proof FIFA World Cup Half Dollar | 14,499 | 15,460 | 961 | 6.63% |
| 2026-P Uncirculated FIFA World Cup Silver Dollar | 4,194 | 4,447 | 253 | 6.03% |
| 2026-P Proof FIFA World Cup Silver Dollar | 16,153 | 17,285 | 1,132 | 7.01% |
| 2026-W $5 Uncirculated FIFA World Cup Gold Coin | 605 | 650 | 45 | 7.44% |
| 2026-W $5 Proof FIFA World Cup Gold Coin | 1,037 | 1,120 | 83 | 8.00% |
| 2026 FIFA World Cup Three-Coin Proof Set | 2,402 | 2,544 | 142 | 5.91% |
2025 Commemorative Coins | ||||
| Old Sales | Latest Sales | Gain/ Loss | % Increase | |
| 2025-S Proof U.S. Marine Corps 250th Anniversary Half Dollar | 24,037 | 24,037 | – | – |
| 2025-S Uncirculated U.S. Marine Corps 250th Anniversary Half Dollar | 9,836 | 9,836 | – | – |
| 2025-P Proof U.S. Marine Corps 250th Anniversary Silver Dollar | 55,487 | 55,487 | – | – |
| 2025-P Uncirculated U.S. Marine Corps 250th Anniversary Silver Dollar | 12,906 | 12,906 | – | – |
| 2025-W Proof U.S. Marine Corps 250th Anniversary $5 Gold Coin | 2,093 | 2,093 | – | – |
| 2025-W Uncirculated U.S. Marine Corps 250th Anniversary $5 Gold Coin | 1,472 | 1,472 | – | – |
| 2025 U.S. Marine Corps 250th Anniversary Three-Coin Proof Set | 7,340 | 7,340 | – | – |
Morgan & Peace Silver Dollars | ||||
| Old Sales | Latest Sales | Gain/ Loss | % Increase | |
| 2026-P Reverse Proof Morgan Silver Dollar | 158,647 | 163,013 | 4,366 | 2.75% |
| 2026-P Reverse Proof Peace Silver Dollar | 145,095 | 148,596 | 3,501 | 2.41% |
| 2025-S Morgan & Peace Silver Dollar Reverse Proof Set | 122,275 | 122,381 | 106 | 0.09% |
| 2025-S Proof Morgan Silver Dollar | 146,672 | 146,809 | 137 | 0.09% |
| 2025-S Proof Morgan Silver Dollar (Bulk – 40 Coins) | 328 | 328 | – | – |
| 2025-S Proof Peace Silver Dollar | 129,578 | 129,647 | 69 | 0.05% |
| 2025-S Proof Peace Silver Dollar (Bulk – 40 Coins) | 328 | 328 | – | – |
| 2025-P Uncirculated Morgan Silver Dollar | 113,401 | 113,434 | 33 | 0.03% |
| 2025-P Uncirculated Morgan Silver Dollar (40 – Bulk) | 318 | 318 | – | – |
| 2025-P Uncirculated Peace Silver Dollar | 106,299 | 106,317 | 18 | 0.02% |
| 2025-P Uncirculated Peace Silver Dollar (40 – Bulk) | 320 | 320 | – | – |
| 2024-S Morgan & Peace Silver Dollar Reverse Proof Set | 160,580 | 160,593 | 13 | 0.01% |
| 2024-S Proof Morgan Silver Dollar | 178,719 | 178,726 | 7 | 0.00% |
| 2024-S Proof Morgan Silver Dollar (Bulk – 40 Coins) | 304 | 304 | – | – |
| 2024-S Proof Peace Silver Dollar | 159,620 | 159,624 | 4 | 0.00% |
| 2024-S Proof Peace Silver Dollar (Bulk – 40 Coins) | 304 | 304 | – | – |
| 2024-P Uncirculated Morgan Silver Dollar | 168,288 | 168,292 | 4 | 0.00% |
| 2024-P Uncirculated Morgan Silver Dollar (40 – Bulk) | 316 | 316 | – | – |
| 2024-P Uncirculated Peace Silver Dollar | 158,917 | 158,925 | 8 | 0.01% |
| 2024-P Uncirculated Peace Silver Dollar (40 – Bulk) | 309 | 309 | – | – |
| 2023-S Morgan & Peace Silver Dollar Reverse Proof Set | 247,820 | 247,820 | – | – |
| 2023-S Proof Morgan Silver Dollar | 366,736 | 366,748 | 12 | 0.00% |
| 2023-S Proof Morgan Silver Dollar (Bulk – 40 Coins) | 443 | 443 | – | – |
| 2023-S Proof Peace Silver Dollar | 330,544 | 330,556 | 12 | 0.00% |
| 2023-S Proof Peace Silver Dollar (Bulk – 40 Coins) | 438 | 438 | – | – |
| 2023-P Uncirculated Morgan Silver Dollar | 260,527 | 260,527 | – | – |
| 2023-P Uncirculated Morgan Silver Dollar (40 – Bulk) | 330 | 330 | – | – |
| 2023-P Uncirculated Peace Silver Dollar | 260,450 | 260,450 | – | – |
| 2023-P Uncirculated Peace Silver Dollar (40 – Bulk) | 338 | 338 | – | – |
Comic Art Coin and Medals | ||||
| Old Sales | Latest Sales | Gain/ Loss | % Increase | |
| 2025-W $50 Proof Wonder Woman Gold Coin | 1,832 | 1,839 | 7 | 0.38% |
| 2025 Wonder Woman 2.5-Ounce Silver Medal | 6,615 | 6,652 | 37 | 0.56% |
| 2025 Wonder Woman 1-Ounce Silver Medal | 18,623 | 18,671 | 48 | 0.26% |
| 2025-W $50 Proof Batman Gold Coin | 2,321 | 2,323 | 2 | 0.09% |
| 2025 Batman 2.5 Ounce Silver Medal | 8,971 | 9,001 | 30 | 0.33% |
| 2025 Batman 1 Ounce Silver Medal | 22,885 | 22,900 | 15 | 0.07% |
| 2025-W $50 Proof Superman Gold Coin | 5,803 | 5,803 | – | – |
| 2025 Superman 2.5 Ounce Silver Medal | 15,960 | 15,980 | 20 | 0.13% |
| 2025 Superman 1 Ounce Silver Medal | 30,117 | 30,154 | 37 | 0.12% |
2026 Best of Mint Series | ||||
| Old Sales | Latest Sales | Gain/ Loss | % Increase | |
| 1916 Standing Liberty Quarter Gold Coin and Silver Medal Set | 14,101 | 14,983 | 882 | 6.25% |
| 1916 Mercury Dime Gold Coin and Silver Medal Set | 28,596 | 28,549 | -47 | -0.16% |
Freedom Ringing Series | ||||
| Old Sales | Latest Sales | Gain/ Loss | % Increase | |
| 1776 ~ 2026 $250 Freedom Ringing Liberty Bell 1-Ounce Gold Coin | – | 1,428 | – | – |
| 1776 ~ 2026 $125 Freedom Ringing 1/2-Ounce Gold Coin | – | 1,622 | – | – |
| 1776 ~ 2026 Freedom Ringing Liberty Bell 1/2 Ounce Silver Medal | – | 2,021 | – | – |
25th Anniversary | ||||
| Old Sales | Latest Sales | Gain/ Loss | % Increase | |
| 2025-W Proof Sacagawea Gold Dollar Coin | 7,478 | 7,478 | – | – |
230th Anniversary Flowing Hair | ||||
| Old Sales | Latest Sales | Gain/ Loss | % Increase | |
| 2024 Flowing Hair Gold Coin | 9,986 | 9,986 | – | – |
| 2024 Flowing Hair Silver Medal (Includes 8,926 from Bulk Sales) | 49,984 | 49,984 | – | – |
Armed Forces Silver Medals | ||||
| Old Sales | Latest Sales | Gain/ Loss | % Increase | |
| U.S. Army 2.5 Ounce Silver Medal | 9,988 | 9,988 | – | – |
| U.S. Marine Corps 2.5 Ounce Silver Medal | 9,988 | 9,988 | – | – |
| U.S. Navy 2.5 Ounce Silver Medal | 9,987 | 9,987 | – | – |
| U.S. Coast Guard 2.5 Ounce Silver Medal | 9,955 | 9,955 | – | – |
| U.S. Air Force 2.5 Ounce Silver Medal | 9,953 | 9,953 | – | – |
| U.S. Army 1 Ounce Silver Medal | 24,873 | 24,924 | 51 | 0.21% |
| U.S. Marine Corps 1 Ounce Silver Medal | 28,795 | 28,815 | 20 | 0.07% |
| U.S. Navy 1 Ounce Silver Medal | 29,143 | 29,176 | 33 | 0.11% |
| U.S. Coast Guard 1 Ounce Silver Medal | 22,240 | 22,250 | 10 | 0.04% |
| U.S. Air Force 1 Ounce Silver Medal | 27,536 | 27,561 | 25 | 0.09% |
American Liberty Products | ||||
| Old Sales | Latest Sales | Gain/ Loss | % Increase | |
| 2025-W $100 American Liberty Gold Coin | 11,939 | 11,939 | – | – |
| 2025-P American Liberty Silver Medal | 29,960 | 29,960 | – | – |
| 2023-W $100 American Liberty Gold Coin | 12,196 | 12,196 | – | – |
| 2023-P American Liberty Silver Medal | 44,603 | 44,651 | 48 | 0.11% |
| 2022-P American Liberty Silver Medal | 74,414 | 74,414 | – | – |
| 2021-W $100 American Liberty Gold Coin | 12,471 | 12,471 | – | – |
| 2019-W $100 American Liberty Gold Coin | 24,609 | 24,609 | – | – |
| 2019-P American Liberty Silver Medal | 44,928 | 44,928 | – | – |
| 2018-W $10 American Liberty Gold Coin | 73,265 | 73,293 | 28 | 0.04% |
| 2017 American Liberty Silver Four-Medal Set* | 32,647 | 32,647 | – | – |
| 2017-W $100 American Liberty Gold Coin | 49,697 | 49,697 | – | – |
| 2017-P Proof American Liberty Silver Medal* | 55,187 | 55,187 | – | – |
Clad Proof Sets | ||||
| Old Sales | Latest Sales | Gain/ Loss | % Increase | |
| 2025 Proof Set | 304,807 | 304,807 | – | – |
| 2024 Proof Set* | 355,786 | 355,786 | – | – |
| 2023 Proof Set* | 369,236 | 369,236 | – | – |
| 2022 Proof Set* | 400,002 | 400,002 | – | – |
| 2021 Proof Set* | 512,866 | 512,866 | – | – |
| 2020 Proof Set* | 464,730 | 464,730 | – | – |
| 2019 Proof Set* | 601,364 | 601,364 | – | – |
| 2018 Proof Set* | 517,081 | 517,081 | – | – |
| 2017 Proof Set* | 568,678 | 568,678 | – | – |
| 2025 American Innovation Dollars Proof Set | 61,609 | 61,610 | 1 | 0.00% |
| 2024 American Innovation Dollars Proof Set | 66,049 | 66,049 | – | – |
| 2023 American Innovation Dollars Proof Set | 61,848 | 61,848 | – | – |
| 2022 American Innovation Dollars Proof Set | 86,857 | 86,877 | 20 | 0.02% |
| 2021 American Innovation Dollars Proof Set | 92,634 | 92,649 | 15 | 0.02% |
| 2020 American Innovation Dollars Proof Set | 108,400 | 108,400 | – | – |
| 2019 American Innovation Dollars Proof Set | 149,885 | 149,885 | – | – |
| 2025 American Women Quarters Proof Set | 33,927 | 33,927 | – | – |
| 2024 American Women Quarters Proof Set | 51,916 | 51,916 | – | – |
| 2023 American Women Quarters Proof Set | 60,933 | 60,934 | 1 | 0.00% |
| 2022 American Women Quarters Proof Set* | 42,821 | 42,821 | – | – |
| 2020 America the Beautiful Quarters Proof Set* | 64,242 | 64,242 | – | – |
| 2019 America the Beautiful Quarters Proof Set | 84,697 | 84,697 | – | – |
| 2018 America the Beautiful Quarters Proof Set* | 86,697 | 86,697 | – | – |
Silver Proof Sets | ||||
| Old Sales | Latest Sales | Gain/ Loss | % Increase | |
| 2026 Silver Proof Set | 255,222 | 254,106 | -1,116 | -0.44% |
| 2025 Silver Proof Set | 124,178 | 124,178 | – | – |
| 2024 Silver Proof Set | 170,440 | 170,440 | – | – |
| 2023 Silver Proof Set | 202,007 | 202,068 | 61 | 0.03% |
| 2022 Silver Proof Set* | 249,374 | 249,374 | – | – |
| 2021 Silver Proof Set* | 308,643 | 308,665 | 22 | 0.01% |
| 2020 Silver Proof Set* | 313,183 | 313,183 | – | – |
| 2019 Silver Proof Set* | 415,382 | 415,382 | – | – |
| 2018 Silver Proof Set* | 332,273 | 332,273 | – | – |
| 2018 Silver Reverse Proof Set* | 199,116 | 199,116 | – | – |
| 2025 American Women Quarters Silver Proof Set | 26,629 | 26,629 | – | – |
| 2024 American Women Quarters Silver Proof Set | 35,010 | 35,010 | – | – |
| 2023 American Women Quarters Silver Proof Set | 47,277 | 47,278 | 1 | 0.00% |
| 2022 American Women Quarters Silver Proof Set | 57,768 | 57,768 | – | – |
| 2020 America the Beautiful Quarters Silver Proof Set* | 64,012 | 64,012 | – | – |
| 2019 America the Beautiful Quarters Silver Proof Set* | 78,588 | 78,588 | – | – |
| 2018 America the Beautiful Quarters Silver Proof Set* | 79,301 | 79,301 | – | – |
| 2026 Congratulations Gift Set | 59,955 | 59,957 | 2 | 0.00% |
| 2025 Congratulations Gift Set | 36,066 | 36,121 | 55 | 0.15% |
| 2024 Congratulations Gift Set | 28,000 | 28,004 | 4 | 0.01% |
| 2023 Congratulations Gift Set | 39,412 | 39,412 | – | – |
| 2022 Congratulations Gift Set | 29,710 | 29,710 | – | – |
| 2021 Congratulations Gift Set* | 39,997 | 39,997 | – | – |
| 2020 Congratulations Gift Set* | 24,468 | 24,468 | – | – |
| 2019 Congratulations Gift Set* | 31,638 | 31,638 | – | – |
| 2025 Limited Edition Silver Proof Set | 24,891 | 24,891 | – | – |
| 2024 Limited Edition Silver Proof Set | 32,052 | 32,123 | 71 | 0.22% |
| 2023 Limited Edition Silver Proof Set | 32,733 | 32,766 | 33 | 0.10% |
| 2022 Limited Edition Silver Proof Set* | 49,733 | 49,733 | – | – |
| 2021 Limited Edition Silver Proof Set* | 49,852 | 49,852 | – | – |
| 2020 Limited Edition Silver Proof Set* | 50,061 | 50,061 | – | – |
US Mint Uncirculated Sets | ||||
| Old Sales | Latest Sales | Gain/ Loss | % Increase | |
| 2026 Uncirculated Mint Set | 294,812 | 292,248 | -2,564 | -0.87% |
| 2025 Uncirculated Mint Set | 188,829 | 188,829 | – | – |
| 2024 Uncirculated Mint Set | 188,930 | 188,930 | – | – |
| 2023 Uncirculated Mint Set | 184,349 | 184,349 | – | – |
| 2022 Uncirculated Mint Set* | 249,964 | 249,964 | – | – |
| 2021 Uncirculated Mint Set | 240,468 | 240,520 | 52 | 0.02% |
| 2020 Uncirculated Mint Set* | 211,787 | 211,787 | – | – |
| 2019 Uncirculated Mint Set* | 346,117 | 346,117 | – | – |
| 2018 Uncirculated Mint Set* | 257,536 | 257,536 | – | – |
| 2017 Uncirculated Mint Set* | 286,813 | 286,813 | – | – |
| 2017-S Enhanced Uncirculated Set* | 210,419 | 210,419 | – | – |
Kids Coin Sets | ||||
| Old Sales | Latest Sales | Gain/ Loss | % Increase | |
| 2019 Youth Coin and Currency Set | 24,888 | 24,888 | – | – |
| 2019 Explore and Discover Coin Set | 48,783 | 48,800 | 17 | 0.03% |
| 2019 Rocketship* | 49,921 | 49,921 | – | – |
| 2014 Coin Discovery Set* | 13,151 | 13,151 | – | – |
Ornaments | ||||
| Old Sales | Latest Sales | Gain/ Loss | % Increase | |
| 2025 Mighty Minters Ornament | 3,539 | 3,548 | 9 | 0.25% |
| 2025 U.S. Mint Ornament | 4,964 | 4,964 | – | – |
| 2025 Ida B. Wells Quarter Ornament | 882 | 882 | – | – |
| 2025 Juliette Gordon Low Quarter Ornament | 1,767 | 1,767 | – | – |
| 2025 Dr. Vera Rubin Quarter Ornament | 900 | 900 | – | – |
| 2025 Stacey Park Milbern Quarter Ornament | 831 | 831 | – | – |
| 2025 Althea Gibson Quarter Ornament | 939 | 939 | – | – |
| 2024 Mighty Minters Ornament | 4,023 | 4,029 | 6 | 0.15% |
| 2024 U.S. Mint Ornament | 4,982 | 4,982 | – | – |
| 2024 Rev. Dr. Pauli Murray Ornament | 960 | 960 | – | – |
| 2024 Patsy Takemoto Mink Ornament | 1,016 | 1,016 | – | – |
| 2024 Dr. Mary Edwards Walker Ornament | 1,212 | 1,212 | – | – |
| 2024 Celia Cruz Ornament | 2,410 | 2,410 | – | – |
| 2024 Zitkala-Ša Ornament | 985 | 985 | – | – |
| 2023 U.S. Mint Ornament | 5,782 | 5,788 | 6 | 0.10% |
| 2023 Mighty Minters Ornament | 3,562 | 3,570 | 8 | 0.22% |
| 2022 U.S. Mint Ornament | 6,395 | 6,401 | 6 | 0.09% |
| 2022 Mighty Minters Ornament | 4,519 | 4,530 | 11 | 0.24% |
| 2023 Bessie Coleman Ornament | 1,409 | 1,409 | – | – |
| 2023 Edith Kanakaʻole Ornament; | 1,593 | 1,593 | – | – |
| 2023 Eleanor Roosevelt Ornament | 2,007 | 2,007 | – | – |
| 2023 Jovita Idar Ornament | 1,391 | 1,391 | – | – |
| 2023 Maria Tallchief Ornament | 1,642 | 1,642 | – | – |
| 2022 Maya Angelou Ornament | 3,702 | 3,702 | – | – |
| 2022 Dr. Sally Ride Ornament | 3,759 | 3,759 | – | – |
| 2022 Wilma Mankiller Ornament | 2,505 | 2,505 | – | – |
| 2022 Nina Otero-Warren Ornament | 1,910 | 1,910 | – | – |
| 2022 Anna May Wong Ornament | 3,433 | 3,433 | – | – |
| 2021 Mighty Minters Ornament | 4,821 | 4,821 | – | – |
| 2021 U.S. Mint Ornament | 7,975 | 7,975 | – | – |
| 2020 Mighty Minters Ornament | 4,593 | 4,594 | 1 | 0.02% |
| 2020 U.S. Mint Ornament | 6,719 | 6,719 | – | – |
| 2019 Mighty Minters Ornament | 7,112 | 7,113 | 1 | 0.01% |
| 2019 U.S. Mint Ornament | 11,986 | 11,986 | – | – |
Proof & Reverse Proof Silver Eagles | ||||
| Old Sales | Latest Sales | Gain/ Loss | % Increase | |
| 2026-W Proof Silver Eagle | 399,158 | 403,816 | 4,658 | 1.17% |
| 2025-P 250th Anniversary U.S. Marine Corps Proof Silver Eagle | 98,739 | 99,749 | 1,010 | 1.02% |
| 2025-S Proof 250th Anniversary U.S. Navy Silver Eagle | 99,891 | 99,891 | – | – |
| 2025-W Proof Laser Engraved Silver Eagle | 99,295 | 99,295 | – | – |
| 2025-W Proof 250th Anniversary U.S. Army Silver Eagle | 99,963 | 99,963 | – | – |
| 2025-S Proof Silver Eagle | 109,662 | 109,662 | – | – |
| 2025-S Proof Silver Eagle (Bulk – 40 Coins) | 552 | 552 | – | – |
| 2025-W Proof Silver Eagle | 299,305 | 299,307 | 2 | 0.00% |
| 2025-W Proof Silver Eagle (Bulk – 40 Coins) | 801 | 801 | – | – |
| 2024-S Proof Silver Eagle | 146,257 | 146,283 | 26 | 0.02% |
| 2024-S Proof Silver Eagle (Bulk – 40 Coins) | 915 | 915 | – | – |
| 2024-W Proof Silver Eagle | 293,589 | 293,610 | 21 | 0.01% |
| 2024-W Proof Silver Eagle (Bulk – 40 Coins) | 1,543 | 1,543 | – | – |
| 2023-S Proof Silver Eagle | 190,817 | 190,832 | 15 | 0.01% |
| 2023-S Proof Silver Eagle (Bulk – 40 Coins) | 743 | 743 | – | – |
| 2022-S Proof Silver Eagle | 199,698 | 199,698 | – | – |
| 2022-S Proof Silver Eagle (Bulk – 40 Coins) | 2,925 | 2,925 | – | – |
| 2023-W Proof Silver Eagle | 436,488 | 436,491 | 3 | 0.00% |
| 2023-W Proof Silver Eagle (Bulk – 40 Coins) | 2,118 | 2,118 | – | – |
| 2022-W Proof Silver Eagle | 496,994 | 496,994 | – | – |
| 2022-W Proof Silver Eagle (Bulk – 40 Coins) | 4,171 | 4,171 | – | – |
| 2021 Reverse Proof American Silver Eagle Two-Coin Set* | 124,918 | 124,918 | – | – |
| 2021-S Proof Silver Eagle, Type 2* | 199,744 | 199,744 | – | – |
| 2021-S Proof Silver Eagle, Type 2 (Bulk – 40 Coins)* | 652 | 652 | – | – |
| 2021-W Proof Silver Eagle, Type 2* | 300,097 | 300,097 | – | – |
| 2021-W Proof Silver Eagle, Type 2 (Bulk – 40 Coins)* | 2,142 | 2,142 | – | – |
| 2021-W Proof Silver Eagle, Type 1* | 299,898 | 299,898 | – | – |
| 2021-W Proof Silver Eagle, Type 1 (Bulk – 40 Coins)* | 686 | 686 | – | – |
Uncirculated Silver Eagles | ||||
| Old Sales | Latest Sales | Gain/ Loss | % Increase | |
| 2025 | 89,806 | 89,807 | 1 | 0.00% |
| 2025 Bulk 40 | 305 | 305 | – | – |
| 2024 | 130,747 | 130,805 | 58 | 0.04% |
| 2024 Bulk 40 | 500 | 500 | – | – |
| 2023 | 153,828 | 153,852 | 24 | 0.02% |
| 2023 Bulk 40 | 599 | 599 | – | – |
| 2022 | 180,621 | 180,625 | 4 | 0.00% |
| 2022 Bulk 40 | 989 | 989 | – | – |
| 2021* | 174,933 | 174,933 | – | – |
| 2021 Bulk 40* | 324 | 324 | – | – |
2026 Proof American Eagle Gold Coins | ||||
| Old Sales | Latest Sales | Gain/ Loss | % Increase | |
| 1 oz | 7,691 | 8,026 | 335 | 4.36% |
| 1/2 oz | 3,440 | 3,448 | 8 | 0.23% |
| 1/4 oz | 5,942 | 5,960 | 18 | 0.30% |
| 1/10 oz | 13,816 | 13,830 | 14 | 0.10% |
| 4-Coin Set | 6,192 | 6,255 | 63 | 1.02% |
2025 Proof American Eagle Gold Coins | ||||
| Old Sales | Latest Sales | Gain/ Loss | % Increase | |
| 1 oz | 4,028 | 4,071 | 43 | 1.07% |
| 1/2 oz | 1,983 | 1,983 | – | – |
| 1/4 oz | 3,915 | 3,960 | 45 | 1.15% |
| 1/10 oz | 7,973 | 7,973 | – | – |
| 4-Coin Set | 3,009 | 3,010 | 1 | 0.03% |
2024 Proof American Eagle Gold Coins | ||||
| Old Sales | Latest Sales | Gain/ Loss | % Increase | |
| 1 oz | 4,038 | 4,039 | 1 | 0.02% |
| 1/2 oz | 2,401 | 2,406 | 5 | 0.21% |
| 1/4 oz | 5,677 | 5,682 | 5 | 0.09% |
| 1/10 oz | 12,463 | 12,463 | – | – |
| 4-Coin Set | 4,900 | 4,901 | 1 | 0.02% |
2023 Proof American Eagle Gold Coins | ||||
| Old Sales | Latest Sales | Gain/ Loss | % Increase | |
| 1 oz | 6,478 | 6,478 | – | – |
| 1/2 oz | 2,011 | 2,011 | – | – |
| 1/4 oz | 4,493 | 4,493 | – | – |
| 1/10 oz | 13,424 | 13,424 | – | – |
| 4-Coin Set | 9,979 | 9,979 | – | – |
2022 Proof American Eagle Gold Coins | ||||
| Old Sales | Latest Sales | Gain/ Loss | % Increase | |
| 1 oz | 5,913 | 5,913 | – | – |
| 1/2 oz | 1,970 | 1,970 | – | – |
| 1/4 oz | 4,464 | 4,464 | – | – |
| 1/10 oz | 13,806 | 13,806 | – | – |
| 4-Coin Set | 9,906 | 9,906 | – | – |
Uncirculated American Eagle Gold Coins | ||||
| Old Sales | Latest Sales | Gain/ Loss | % Increase | |
| 2026 (Enhanced Uncirculated) | 7,362 | 7,511 | 149 | 2.02% |
| 2025 | 2,699 | 2,718 | 19 | 0.70% |
| 2024 | 3,000 | 3,004 | 4 | 0.13% |
| 2023 | 6,630 | 6,633 | 3 | 0.05% |
| 2022 | 8,900 | 8,900 | – | – |
| 2021* | 9,063 | 9,063 | – | – |
| 2020* | 6,284 | 6,284 | – | – |
| 2019* | 5,851 | 5,851 | – | – |
Proof American Buffalo Gold Coins | ||||
| Old Sales | Latest Sales | Gain/ Loss | % Increase | |
| 2026 Proof Gold Buffalo | 14,680 | 14,678 | -2 | -0.01% |
| 2025 Proof Gold Buffalo | 7,861 | 7,943 | 82 | 1.04% |
| 2024 Proof Gold Buffalo | 10,634 | 10,649 | 15 | 0.14% |
| 2023 Proof Gold Buffalo | 15,911 | 15,911 | – | – |
| 2022 Proof Gold Buffalo | 15,943 | 15,943 | – | – |
| 2021 Proof Gold Buffalo* | 16,976 | 16,976 | – | – |
| 2020 Proof Gold Buffalo* | 11,887 | 11,887 | – | – |
| 2019 Proof Gold Buffalo* | 14,844 | 14,844 | – | – |
Proof American Platinum Eagle | ||||
| Old Sales | Latest Sales | Gain/ Loss | % Increase | |
| 2026 | 5,925 | 6,098 | 173 | 2.92% |
| 2025* | 6,464 | 6,474 | 10 | 0.15% |
| 2024 | 9,569 | 9,572 | 3 | 0.03% |
| 2023 | 9,317 | 9,326 | 9 | 0.10% |
| 2022* | 9,941 | 9,941 | – | – |
| 2021* | 9,884 | 9,884 | – | – |
| 2020* | 9,837 | 9,837 | – | – |
| 2019* | 11,268 | 11,268 | – | – |
| 2018* | 19,180 | 19,180 | – | – |
| 2017* | 8,890 | 8,890 | – | – |
American Palladium Eagle | ||||
| Old Sales | Latest Sales | Gain/ Loss | % Increase | |
| 2025-W Reverse Proof | 3,991 | 3,991 | – | – |
| 2024-W Proof | 5,961 | 5,961 | – | – |
| 2023-W Uncirculated | 5,783 | 5,783 | – | – |
| 2022-W Reverse Proof | 7,439 | 7,439 | – | – |
| 2021-W Proof | 5,170 | 5,170 | – | – |
| 2020-W Uncirculated | 9,746 | 9,746 | – | – |
| 2019-W Reverse Proof | 18,839 | 18,839 | – | – |
| 2018-W Proof* | 14,986 | 14,986 | – | – |
Presidential Silver Medals | ||||
| Old Sales | Latest Sales | Gain/ Loss | % Increase | |
| (2026) Warren G. Harding Presidential Silver Medal | 8,558 | 8,569 | 11 | 0.13% |
| (2026) Woodrow Wilson Presidential Silver Medal | 9,034 | 9,041 | 7 | 0.08% |
| (2025) William H. Taft Presidential Silver Medal | 10,410 | 10,418 | 8 | 0.08% |
| (2025) Theodore Roosevelt Presidential Silver Medal | 12,932 | 12,944 | 12 | 0.09% |
| (2025) William McKinley Presidential Silver Medal | 10,736 | 10,739 | 3 | 0.03% |
| (2025) Benjamin Harrison Presidential Silver Medal | 10,680 | 10,681 | 1 | 0.01% |
| (2024) Grover Cleveland Presidential Silver Medal | 11,952 | 11,954 | 2 | 0.02% |
| (2024) Chester A. Arthur Presidential Silver Medal | 11,457 | 11,458 | 1 | 0.01% |
| (2024) James A. Garfield Presidential Silver Medal | 12,182 | 12,183 | 1 | 0.01% |
| (2024) Rutherford B. Hayes Presidential Silver Medal | 12,258 | 12,260 | 2 | 0.02% |
| (2023) Ulysses S. Grant Presidential Silver Medal | 15,038 | 15,039 | 1 | 0.01% |
| (2023) Andrew Johnson Presidential Silver Medal | 13,145 | 13,145 | – | – |
| (2023) Abraham Lincoln Presidential Silver Medal | 23,047 | 23,062 | 15 | 0.07% |
| (2023) James Buchanan Presidential Silver Medal | 12,948 | 12,950 | 2 | 0.02% |
| (2021) Franklin Pierce Presidential Silver Medal | 13,168 | 13,170 | 2 | 0.02% |
| (2022) Millard Fillmore Presidential Silver Medal | 13,215 | 13,220 | 5 | 0.04% |
| (2022) Zachary Taylor Presidential Silver Medal | 13,621 | 13,625 | 4 | 0.03% |
| (2022) James Knox Polk Presidential Silver Medal | 13,925 | 13,929 | 4 | 0.03% |
| (2021) John Tyler Presidential Silver Medal | 14,265 | 14,266 | 1 | 0.01% |
| (2021) William Henry Harrison Presidential Silver Medal | 14,253 | 14,253 | – | – |
| (2021) Martin Van Buren Presidential Silver Medal | 14,415 | 14,417 | 2 | 0.01% |
| (2020) Andrew Jackson Presidential Silver Medal | 17,926 | 17,927 | 1 | 0.01% |
| (2019) John Quincy Adams Presidential Silver Medal | 15,517 | 15,518 | 1 | 0.01% |
| (2019) James Monroe Presidential Silver Medal | 16,021 | 16,023 | 2 | 0.01% |
| (2019) James Madison Presidential Silver Medal | 17,828 | 17,832 | 4 | 0.02% |
| (2019) Thomas Jefferson Presidential Silver Medal | 26,458 | 26,463 | 5 | 0.02% |
| (2018) George Washington Presidential Silver Medal | 39,588 | 39,604 | 16 | 0.04% |
| (2018) John Adams Presidential Silver Medal | 24,644 | 24,647 | 3 | 0.01% |
American Innovation Reverse Proof Sets | ||||
| Old Sales | Latest Sales | Gain/ Loss | % Increase | |
| 2025 | 40,405 | 40,536 | 131 | 0.32% |
| 2024 | 36,150 | 36,150 | – | – |
| 2023 | 43,824 | 43,851 | 27 | 0.06% |
| 2022* | 49,851 | 49,851 | – | – |
| 2021* | 49,813 | 49,813 | – | – |
2026 American Innovation Dollars – California | ||||
| Old Sales | Latest Sales | Gain/ Loss | % Increase | |
| 25-coin roll set (P) | 9,477 | 9,487 | 10 | 0.11% |
| 25-coin roll set (D) | 8,382 | 8,384 | 2 | 0.02% |
| 100-coin bag (P) | 3,788 | 3,797 | 9 | 0.24% |
| 100-coin bag (D) | 3,606 | 3,613 | 7 | 0.19% |
2026 American Innovation Dollars – Wisconsin | ||||
| Old Sales | Latest Sales | Gain/ Loss | % Increase | |
| 25-coin roll set (P) | 8,362 | 8,360 | -2 | -0.02% |
| 25-coin roll set (D) | 7,318 | 7,316 | -2 | -0.03% |
| 100-coin bag (P) | 3,110 | 3,125 | 15 | 0.48% |
| 100-coin bag (D) | 2,909 | 2,931 | 22 | 0.76% |
2026 American Innovation Dollars – Iowa | ||||
| Old Sales | Latest Sales | Gain/ Loss | % Increase | |
| 25-coin roll set (P) | 8,349 | 8,391 | 42 | 0.50% |
| 25-coin roll set (D) | 7,245 | 7,288 | 43 | 0.59% |
| 100-coin bag (P) | 3,132 | 3,138 | 6 | 0.19% |
| 100-coin bag (D) | 2,922 | 2,933 | 11 | 0.38% |
2025 American Innovation Dollars – Texas | ||||
| Old Sales | Latest Sales | Gain/ Loss | % Increase | |
| 25-coin roll set (P) | 9,093 | 9,093 | – | – |
| 25-coin roll set (D) | 8,048 | 8,048 | – | – |
| 100-coin bag (P) | 3,638 | 3,638 | – | – |
| 100-coin bag (D) | 3,444 | 3,444 | – | – |
2025 American Innovation Dollars – Florida | ||||
| Old Sales | Latest Sales | Gain/ Loss | % Increase | |
| 25-coin roll set (P) | 9,078 | 9,078 | – | – |
| 25-coin roll set (D) | 8,039 | 8,039 | – | – |
| 100-coin bag (P) | 3,636 | 3,636 | – | – |
| 100-coin bag (D) | 3,440 | 3,440 | – | – |
2025 American Innovation Dollars – Michigan | ||||
| Old Sales | Latest Sales | Gain/ Loss | % Increase | |
| 25-coin roll set (P) | 8,882 | 8,882 | – | – |
| 25-coin roll set (D) | 7,839 | 7,839 | – | – |
| 100-coin bag (P) | 3,645 | 3,645 | – | – |
| 100-coin bag (D) | 3,444 | 3,444 | – | – |
2025 American Innovation Dollars – Arkansas | ||||
| Old Sales | Latest Sales | Gain/ Loss | % Increase | |
| 25-coin roll set (P) | 8,280 | 8,280 | – | – |
| 25-coin roll set (D) | 7,336 | 7,336 | – | – |
| 100-coin bag (P) | 3,140 | 3,140 | – | – |
| 100-coin bag (D) | 2,624 | 2,643 | 19 | 0.72% |
2024 American Innovation Dollars – Missouri | ||||
| Old Sales | Latest Sales | Gain/ Loss | % Increase | |
| 25-coin roll set (P) | 8,381 | 8,381 | – | – |
| 25-coin roll set (D) | 7,343 | 7,343 | – | – |
| 100-coin bag (P) | 3,148 | 3,148 | – | – |
| 100-coin bag (D) | 2,925 | 2,925 | – | – |
2024 American Innovation Dollars – Maine | ||||
| Old Sales | Latest Sales | Gain/ Loss | % Increase | |
| 25-coin roll set (P) | 8,221 | 8,221 | – | – |
| 25-coin roll set (D) | 7,340 | 7,340 | – | – |
| 100-coin bag (P) | 3,195 | 3,205 | 10 | 0.31% |
| 100-coin bag (D) | 2,500 | 2,506 | 6 | 0.24% |
2024 American Innovation Dollars – Alabama | ||||
| Old Sales | Latest Sales | Gain/ Loss | % Increase | |
| 25-coin roll set (P) | 8,394 | 8,394 | – | – |
| 25-coin roll set (D) | 7,443 | 7,443 | – | – |
| 100-coin bag (P) | 3,149 | 3,149 | – | – |
| 100-coin bag (D) | 2,950 | 2,950 | – | – |
2024 American Innovation Dollars – Illinois | ||||
| Old Sales | Latest Sales | Gain/ Loss | % Increase | |
| 25-coin roll set (P) | 8,335 | 8,335 | – | – |
| 25-coin roll set (D) | 7,332 | 7,332 | – | – |
| 100-coin bag (P) | 3,154 | 3,155 | 1 | 0.03% |
| 100-coin bag (D) | 2,941 | 2,941 | – | – |
2023 American Innovation Dollars – Mississippi | ||||
| Old Sales | Latest Sales | Gain/ Loss | % Increase | |
| 25-coin roll set (P) | 7,953 | 7,953 | – | – |
| 25-coin roll set (D) | 6,964 | 6,964 | – | – |
| 100-coin bag (P) | 2,812 | 2,818 | 6 | 0.21% |
| 100-coin bag (D) | 2,776 | 2,778 | 2 | 0.07% |
2023 American Innovation Dollars – Indiana | ||||
| Old Sales | Latest Sales | Gain/ Loss | % Increase | |
| 25-coin roll set (P) | 8,022 | 8,022 | – | – |
| 25-coin roll set (D) | 6,994 | 6,994 | – | – |
| 100-coin bag (P) | 3,013 | 3,013 | – | – |
| 100-coin bag (D) | 2,801 | 2,801 | – | – |
2023 American Innovation Dollars – Louisiana | ||||
| Old Sales | Latest Sales | Gain/ Loss | % Increase | |
| 25-coin roll set (P) | 7,993 | 7,993 | – | – |
| 25-coin roll set (D) | 6,990 | 6,990 | – | – |
| 100-coin bag (P) | 2,978 | 2,978 | – | – |
| 100-coin bag (D) | 2,760 | 2,760 | – | – |
2023 American Innovation Dollars – Ohio | ||||
| Old Sales | Latest Sales | Gain/ Loss | % Increase | |
| 25-coin roll set (P) | 8,016 | 8,016 | – | – |
| 25-coin roll set (D) | 6,978 | 6,978 | – | – |
| 100-coin bag (P) | 2,983 | 2,983 | – | – |
| 100-coin bag (D) | 2,762 | 2,762 | – | – |
2022 American Innovation Dollars – Tennessee | ||||
| Old Sales | Latest Sales | Gain/ Loss | % Increase | |
| 25-coin roll set (P) | 7,014 | 7,014 | – | – |
| 25-coin roll set (D) | 7,010 | 7,010 | – | – |
| 100-coin bag (P) | 2,786 | 2,786 | – | – |
| 100-coin bag (D) | 2,786 | 2,786 | – | – |
2022 American Innovation Dollars – Kentucky | ||||
| Old Sales | Latest Sales | Gain/ Loss | % Increase | |
| 25-coin roll set (P) | 7,009 | 7,009 | – | – |
| 25-coin roll set (D) | 7,005 | 7,005 | – | – |
| 100-coin bag (P) | 2,771 | 2,771 | – | – |
| 100-coin bag (D) | 2,780 | 2,780 | – | – |
2022 American Innovation Dollars – Vermont | ||||
| Old Sales | Latest Sales | Gain/ Loss | % Increase | |
| 25-coin roll set (P) | 7,023 | 7,023 | – | – |
| 25-coin roll set (D) | 7,011 | 7,011 | – | – |
| 100-coin bag (P) | 2,787 | 2,787 | – | – |
| 100-coin bag (D) | 2,784 | 2,784 | – | – |
2022 American Innovation Dollars – Rhode Island | ||||
| Old Sales | Latest Sales | Gain/ Loss | % Increase | |
| 25-coin roll set (P) | 7,010 | 7,010 | – | – |
| 25-coin roll set (D) | 7,007 | 7,007 | – | – |
| 100-coin bag (P) | 2,789 | 2,789 | – | – |
| 100-coin bag (D) | 2,787 | 2,787 | – | – |
2021 American Innovation Dollars – North Carolina | ||||
| Old Sales | Latest Sales | Gain/ Loss | % Increase | |
| 25-coin roll set (P) | 7,010 | 7,010 | – | – |
| 25-coin roll set (D) | 7,018 | 7,018 | – | – |
| 100-coin bag (P) | 2,789 | 2,789 | – | – |
| 100-coin bag (D) | 2,790 | 2,790 | – | – |
2021 American Innovation Dollars – New York | ||||
| Old Sales | Latest Sales | Gain/ Loss | % Increase | |
| 25-coin roll set (P) | 7,006 | 7,006 | – | – |
| 25-coin roll set (D) | 7,013 | 7,013 | – | – |
| 100-coin bag (P) | 2,786 | 2,786 | – | – |
| 100-coin bag (D) | 2,785 | 2,785 | – | – |
2021 American Innovation Dollars – Virginia | ||||
| Old Sales | Latest Sales | Gain/ Loss | % Increase | |
| 25-coin roll set (P) | 7,015 | 7,015 | – | – |
| 25-coin roll set (D) | 7,010 | 7,010 | – | – |
| 100-coin bag (P) | 2,796 | 2,796 | – | – |
| 100-coin bag (D) | 2,786 | 2,786 | – | – |
2021 American Innovation Dollars – New Hampshire | ||||
| Old Sales | Latest Sales | Gain/ Loss | % Increase | |
| 25-coin roll set (P) | 7,017 | 7,017 | – | – |
| 25-coin roll set (D) | 7,017 | 7,017 | – | – |
| 100-coin bag (P) | 2,789 | 2,789 | – | – |
| 100-coin bag (D) | 2,790 | 2,790 | – | – |
2020 American Innovation Dollars – South Carolina | ||||
| Old Sales | Latest Sales | Gain/ Loss | % Increase | |
| Reverse Proof (S) | 45,082 | 45,120 | 38 | 0.08% |
| 25-coin roll set (P) | 6,378 | 6,378 | – | – |
| 25-coin roll set (D) | 6,399 | 6,399 | – | – |
| 100-coin bag (P) | 2,734 | 2,734 | – | – |
| 100-coin bag (D) | 2,378 | 2,378 | – | – |
2020 American Innovation Dollars – Maryland | ||||
| Old Sales | Latest Sales | Gain/ Loss | % Increase | |
| Reverse Proof (S) | 49,852 | 49,852 | – | – |
| 25-coin roll set (P) | 6,493 | 6,493 | – | – |
| 25-coin roll set (D) | 6,471 | 6,471 | – | – |
| 100-coin bag (P) | 2,725 | 2,725 | – | – |
| 100-coin bag (D) | 2,737 | 2,737 | – | – |
2020 American Innovation Dollars – Massachusetts | ||||
| Old Sales | Latest Sales | Gain/ Loss | % Increase | |
| Reverse Proof (S) | 49,785 | 49,785 | – | – |
| 25-coin roll set (P) | 6,486 | 6,486 | – | – |
| 25-coin roll set (D) | 6,481 | 6,481 | – | – |
| 100-coin bag (P) | 2,746 | 2,746 | – | – |
| 100-coin bag (D) | 2,744 | 2,744 | – | – |
2020 American Innovation Dollars – Connecticut | ||||
| Old Sales | Latest Sales | Gain/ Loss | % Increase | |
| Reverse Proof (S) | 48,908 | 48,911 | 3 | 0.01% |
| 25-coin roll set (P) | 6,496 | 6,496 | – | – |
| 25-coin roll set (D) | 6,425 | 6,425 | – | – |
| 100-coin bag (P) | 2,736 | 2,736 | – | – |
| 100-coin bag (D) | 2,747 | 2,747 | – | – |
2019 American Innovation Dollars – Georgia | ||||
| Old Sales | Latest Sales | Gain/ Loss | % Increase | |
| Reverse Proof (S) | 49,025 | 49,030 | 5 | 0.01% |
| 25-coin roll set (P) | 8,094 | 8,094 | – | – |
| 25-coin roll set (D) | 7,542 | 7,542 | – | – |
| 100-coin bag (P) | 3,459 | 3,459 | – | – |
| 100-coin bag (D) | 3,968 | 3,968 | – | – |
2019 American Innovation Dollars – New Jersey | ||||
| Old Sales | Latest Sales | Gain/ Loss | % Increase | |
| Reverse Proof (S) | 54,030 | 54,038 | 8 | 0.01% |
| 25-coin roll set (P) | 9,103 | 9,103 | – | – |
| 25-coin roll set (D) | 8,043 | 8,043 | – | – |
| 100-coin bag (P) | 3,941 | 3,941 | – | – |
| 100-coin bag (D) | 3,586 | 3,586 | – | – |
2019 American Innovation Dollars – Pennsylvania | ||||
| Old Sales | Latest Sales | Gain/ Loss | % Increase | |
| Reverse Proof (S) | 57,720 | 57,724 | 4 | 0.01% |
| 25-coin roll set (P) | 10,458 | 10,458 | – | – |
| 25-coin roll set (D) | 8,536 | 8,536 | – | – |
| 100-coin bag (P) | 3,689 | 3,689 | – | – |
| 100-coin bag (D) | 3,055 | 3,055 | – | – |
2019 American Innovation Dollars – Delaware | ||||
| Old Sales | Latest Sales | Gain/ Loss | % Increase | |
| Reverse Proof (S) | 72,532 | 72,534 | 2 | 0.00% |
| 25-coin roll set (P) | 9,112 | 9,112 | – | – |
| 25-coin roll set (D) | 8,372 | 8,372 | – | – |
| 100-coin bag (P) | 3,203 | 3,203 | – | – |
| 100-coin bag (D) | 3,385 | 3,385 | – | – |
2018 American Innovation Dollars | ||||
| Old Sales | Latest Sales | Gain/ Loss | % Increase | |
| Reverse Proof (S)* | 74,720 | 74,720 | – | – |
| Proof Coin (S) | 255,441 | 255,441 | – | – |
| 25-coin roll set (P) | 22,902 | 22,902 | – | – |
| 25-coin roll set (D) | 25,725 | 25,725 | – | – |
| 100-coin bag (P)* | 2,935 | 2,935 | – | – |
| 100-coin bag (D)* | 2,954 | 2,954 | – | – |
George H.W. Bush Coin & Chronicles Set | ||||
| Old Sales | Latest Sales | Gain/ Loss | % Increase | |
| $1 Coin & Set | 11,544 | 11,549 | 5 | 0.04% |
2020 Bush Presidential $1 Coin & First Spouse Medal Set | ||||
| Old Sales | Latest Sales | Gain/ Loss | % Increase | |
| $1 Coin & Set | 9,876 | 9,876 | – | – |
2020 George H.W. Bush Presidential $1 Coins | ||||
| Old Sales | Latest Sales | Gain/ Loss | % Increase | |
| 25-coin roll (P) | 24,926 | 24,926 | – | – |
| 25-coin roll (D) | 24,854 | 24,854 | – | – |
| 100-coin bag (P) | 2,695 | 2,695 | – | – |
| 100-coin bag (D) | 2,098 | 2,098 | – | – |
| 250-coin bag (P) | 5,025 | 5,028 | 3 | 0.06% |
| 250-coin bag (D) | 6,294 | 6,295 | 1 | 0.02% |
Native American Dollar Rolls | ||||
| Old Sales | Latest Sales | Gain/ Loss | % Increase | |
| 2026-P Native American $1 25 Coin Roll | 14,514 | 14,666 | 152 | 1.05% |
| 2026-D Native American $1 25 Coin Roll | 14,277 | 14,414 | 137 | 0.96% |
| 2026-P Native American $1 100-Coin Bag | 1,585 | 1,796 | 211 | 13.31% |
| 2026-D Native American $1 100-Coin Bag | 1,597 | 1,798 | 201 | 12.59% |
| 2025-P Native American $1 25 Coin Roll | 12,876 | 12,919 | 43 | 0.33% |
| 2025-D Native American $1 25 Coin Roll | 12,412 | 12,451 | 39 | 0.31% |
| 2025-P Native American $1 100-Coin Bag | 1,793 | 1,793 | – | – |
| 2025-D Native American $1 100-Coin Bag | 1,796 | 1,796 | – | – |
| 2025-P Native American $1 250-Coin Box | 1,078 | 1,084 | 6 | 0.56% |
| 2025-D Native American $1 250-Coin Box | 1,096 | 1,103 | 7 | 0.64% |
| 2024-P Native American $1 25 Coin Roll* | 14,686 | 14,686 | – | – |
| 2024-D Native American $1 25 Coin Roll* | 14,679 | 14,679 | – | – |
| 2024-P Native American $1 100-Coin Bag* | 1,746 | 1,746 | – | – |
| 2024-D Native American $1 100-Coin Bag* | 1,795 | 1,795 | – | – |
| 2024-P Native American $1 250-Coin Box* | 1,784 | 1,784 | – | – |
| 2024-D Native American $1 250-Coin Box* | 1,692 | 1,692 | – | – |
| 2023-P Native American $1 25 Coin Roll* | 13,922 | 13,922 | – | – |
| 2023-D Native American $1 25 Coin Roll* | 13,954 | 13,954 | – | – |
| 2023-P Native American $1 100-Coin Bag* | 1,695 | 1,695 | – | – |
| 2023-D Native American $1 100-Coin Bag* | 1,694 | 1,694 | – | – |
| 2023-P Native American $1 250-Coin Box* | 1,698 | 1,698 | – | – |
| 2023-D Native American $1 250-Coin Box* | 1,618 | 1,618 | – | – |
| 2022-P Native American $1 25 Coin Roll* | 13,996 | 13,996 | – | – |
| 2022-D Native American $1 25 Coin Roll* | 13,965 | 13,965 | – | – |
| 2022-P Native American $1 100-Coin Bag* | 1,699 | 1,699 | – | – |
| 2022-D Native American $1 100-Coin Bag* | 1,614 | 1,614 | – | – |
| 2022-P Native American $1 250-Coin Box* | 1,698 | 1,698 | – | – |
| 2022-D Native American $1 250-Coin Box* | 1,699 | 1,699 | – | – |
2026 Semiquincentennial Enduring Liberty Half Dollars | ||||
| Old Sales | Latest Sales | Gain/ Loss | % Increase | |
| Two-Roll Set | 93,096 | 97,635 | 4,539 | 4.88% |
| 200-Coin Bag (P&D) | 37,014 | 38,042 | 1,028 | 2.78% |
Kennedy Half Dollar Rolls | ||||
| Old Sales | Latest Sales | Gain/ Loss | % Increase | |
| 2025-dated 200-coin bag (P&D)* | 11,521 | 11,521 | – | – |
| 2025-dated 2-roll set (P&D)* | 26,199 | 26,199 | – | – |
| 2024-dated 200-coin bag (P&D)* | 11,451 | 11,451 | – | – |
| 2024-dated 2-roll set (P&D)* | 26,261 | 26,261 | – | – |
| 2023-dated 200-coin bag (P&D)* | 11,170 | 11,170 | – | – |
| 2023-dated 2-roll set (P&D)* | 24,987 | 24,987 | – | – |
| 2022-dated 200-coin bag (P&D)* | 10,999 | 10,999 | – | – |
| 2022-dated 2-roll set (P&D)* | 21,926 | 21,926 | – | – |
| 2021-dated 200-coin bag (P&D)* | 9,976 | 9,976 | – | – |
| 2021-dated 2-roll set (P&D)* | 21,989 | 21,989 | – | – |
| 2020-dated 200-coin bag (P&D)* | 11,776 | 11,776 | – | – |
| 2020-dated 2-roll set (P&D)* | 24,312 | 24,312 | – | – |
| 2019-dated 200-coin bag (P&D)* | 11,534 | 11,534 | – | – |
| 2019-dated 2-roll set (P&D)* | 24,132 | 24,132 | – | – |
2026 Semiquincentennial Declaration of Independence Quarters | ||||
| Old Sales | Latest Sales | Gain/ Loss | % Increase | |
| 100-Coin Bag (P) | 6,184 | 6,193 | 9 | 0.15% |
| 100-Coin Bag (D) | 6,154 | 6,196 | 42 | 0.68% |
| Two-Roll Set | 10,380 | 10,390 | 10 | 0.10% |
2026 Semiquincentennial Revolutionary War Quarters | ||||
| Old Sales | Latest Sales | Gain/ Loss | % Increase | |
| 100-Coin Bag (P) | 9,193 | 9,191 | -2 | -0.02% |
| 100-Coin Bag (D) | 6,196 | 6,196 | – | – |
| Two-Roll Set | 10,898 | 10,898 | – | – |
2026 Semiquincentennial Mayflower Compact Quarters | ||||
| Old Sales | Latest Sales | Gain/ Loss | % Increase | |
| 100-Coin Bag (P) | 6,170 | 6,170 | – | – |
| 100-Coin Bag (D) | 6,147 | 6,147 | – | – |
| Two-Roll Set | 10,337 | 10,327 | -10 | -0.10% |
2025 Althea Gibson Quarters | ||||
| Old Sales | Latest Sales | Gain/ Loss | % Increase | |
| Three-Roll Set | 9,806 | 9,806 | – | – |
| 100-Coin Bag (P) | 1,454 | 1,454 | – | – |
| 100-Coin Bag (D) | 967 | 967 | – | – |
| Two-Roll Set | 2,124 | 2,124 | – | – |
2025 Stacey Park Milbern Quarters | ||||
| Old Sales | Latest Sales | Gain/ Loss | % Increase | |
| Three-Roll Set | 9,397 | 9,397 | – | – |
| 100-Coin Bag (P) | 1,436 | 1,436 | – | – |
| 100-Coin Bag (D) | 960 | 960 | – | – |
| Two-Roll Set | 2,110 | 2,110 | – | – |
2025 Dr. Vera Rubin Quarters | ||||
| Old Sales | Latest Sales | Gain/ Loss | % Increase | |
| Three-Roll Set | 9,918 | 9,918 | – | – |
| 100-Coin Bag (P) | 1,667 | 1,667 | – | – |
| 100-Coin Bag (D) | 1,060 | 1,060 | – | – |
| Two-Roll Set | 2,231 | 2,231 | – | – |
2025 Juliette Gordon Low Quarters | ||||
| Old Sales | Latest Sales | Gain/ Loss | % Increase | |
| Three-Roll Set | 11,170 | 11,170 | – | – |
| 100-Coin Bag (P) | 3,290 | 3,290 | – | – |
| 100-Coin Bag (D) | 1,890 | 1,890 | – | – |
| Two-Roll Set | 3,836 | 3,836 | – | – |
2025 Ida B. Wells Quarters | ||||
| Old Sales | Latest Sales | Gain/ Loss | % Increase | |
| Three-Roll Set | 10,651 | 10,651 | – | – |
| 100-Coin Bag (P) | 2,075 | 2,075 | – | – |
| 100-Coin Bag (D) | 1,231 | 1,231 | – | – |
| Two-Roll Set | 2,532 | 2,532 | – | – |
2026 Semiquincentennial Dimes | ||||
| Old Sales | Latest Sales | Gain/ Loss | % Increase | |
| 200-Coin Bag (P & D) | 10,980 | 10,967 | -13 | -0.12% |
| Two-Roll Set | 11,976 | 11,976 | – | – |