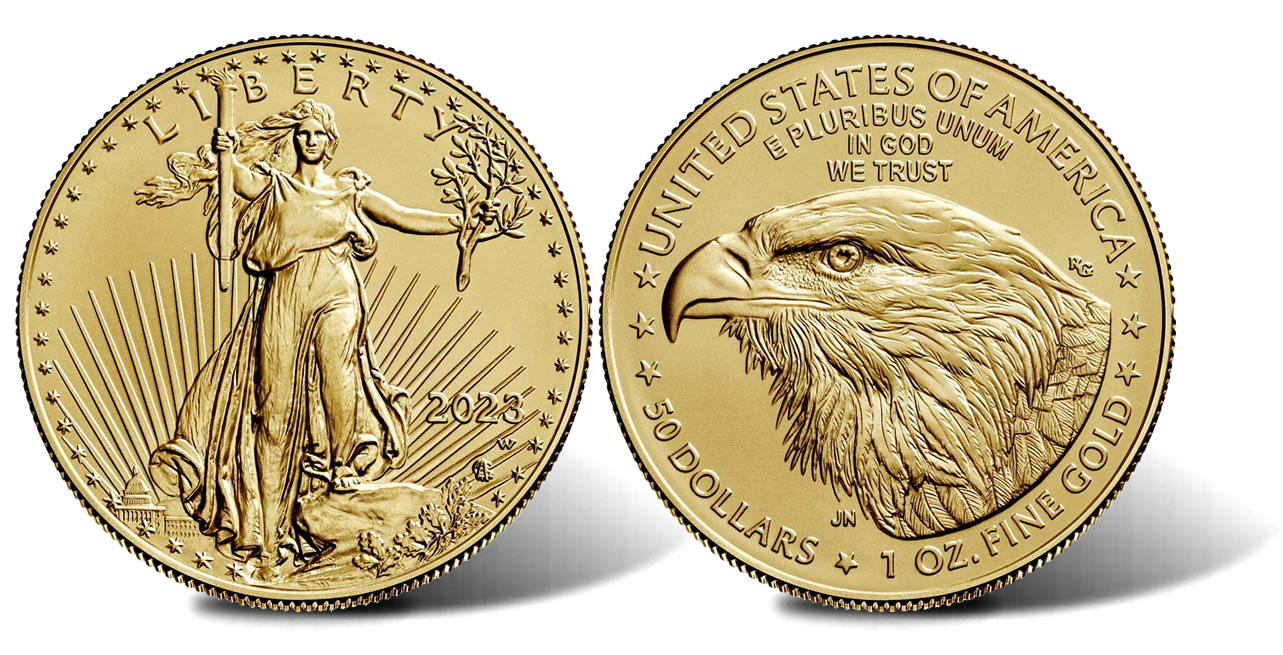
On June 1, the United States Mint introduced the 2023-W Uncirculated American Gold Eagle for sale, with a price tag of $2,820.
According to sales data from the U.S. Mint, collectors purchased a total of 3,525 coins within the first four days, making it the second highest-selling item of the week. However, it also registered as the slowest start in the series since the release of the uncirculated Gold Eagle for 2019.
For comparison, last year’s edition opened with sales of 5,326 coins over the same number of days, initially priced at $2,670.
Here’s a listing of the early sales performances for the coin series since 2011:
- the coin for 2023 started with 3,525
- the coin for 2022 opened with 5,326
- the coin for 2021 debuted with 8,938
- the coin for 2020 started with 6,996
- the coin for 2019 opened with 1,467
- the coin for 2018 began at 4,149
- the coin for 2017 started with 1,881
- the coin for 2016 opened with 2,968
- the coin for 2015 debuted with 2,157
- the coin for 2014 started with 1,844
- the coin for 2013 opened with 1,448
- the coin for 2012 debuted with 1,949
- the coin for 2011 began at 1,098
U.S. Mint Top Sellers
Here’s the listing of the U.S. Mint’s most popular numismatic products for the week ending June 4:
- 2023-W Uncirculated Silver Eagle (+3,597 to 120,632)
- 2023-W $50 Uncirculated American Gold Eagle (+3,525)
- 2023 Congratulations Set (+732 to 33,916)
- 2022 Mint Set (+628 to 231,622)
- 2023 Kennedy Two-Roll Sets (+573 to 25,389)
- 2022-P American Liberty Silver Medal (+530 to 68,951)
- 2023-W $5 Proof Gold Eagle (+422 to 10,356)
- 2023 American Women Quarters Silver Proof Set (+407 to 38,898)
- 2022 Silver Proof Set (+378 to 241,706)
- 2023-W $50 American Gold Buffalo Proof Coin (+302 to 10,781)
In its latest report, the U.S. Mint published sales data for 318 numismatic products. Among these products, 61 outperformed their sales from the previous week, compared to 68 in the prior report. Not counting the new uncirculated Gold Eagle, 1 product saw an increase of more than 1,000 units just like in the previous report.
Elsewhere, the report revealed that 2 products had negative weekly sales against 3 in the prior report. The sales reductions included -1 and -546 for the 2023 Bessie Coleman Quarters Three-Roll Set and the 2023-W Proof Gold Eagle Four-Coin Set, respectively.
US Mint Sales: Numismatic Products
Below are tables showing the latest available sales for U.S. Mint numismatic products. The sales period covers from May 29 to June 4. Products with an asterisk (*) are no longer available or had no reported sales.
Armed Forces Silver Medals | ||||
| Old Sales | Latest Sales | Gain/ Loss | % Increase | |
| U.S. Army 2.5 Ounce Silver Medal | 9,954 | 9,954 | – | – |
| U.S. Marine Corps 2.5 Ounce Silver Medal | 9,576 | 9,576 | – | – |
| U.S. Navy 2.5 Ounce Silver Medal | 9,985 | 9,985 | – | – |
| U.S. Coast Guard 2.5 Ounce Silver Medal | 9,955 | 9,955 | – | – |
| U.S. Air Force 2.5 Ounce Silver Medal | 9,953 | 9,953 | – | – |
| U.S. Coast Guard 1 Ounce Silver Medal | 15,740 | 15,868 | 128 | 0.81% |
| U.S. Air Force 1 Ounce Silver Medal | 16,968 | 17,165 | 197 | 1.16% |
American Liberty Products | ||||
| Old Sales | Latest Sales | Gain/ Loss | % Increase | |
| 2022-P American Liberty Silver Medal | 68,421 | 68,951 | 530 | 0.77% |
| 2021-W $100 American Liberty Gold Coin | 12,471 | 12,471 | – | – |
| 2019-W $100 American Liberty Gold Coin | 24,609 | 24,609 | – | – |
| 2019-P American Liberty Silver Medal | 44,928 | 44,928 | – | – |
| 2018-W $10 American Liberty Gold Coin | 55,759 | 55,825 | 66 | 0.12% |
| 2017 American Liberty Silver Four-Medal Set* | 32,647 | 32,647 | – | – |
| 2017-S Enhanced Uncirculated Coin Set* | 210,419 | 210,419 | – | – |
| 2017-W $100 American Liberty Gold Coin | 38,675 | 38,710 | 35 | 0.09% |
| 2017-P Proof American Liberty Silver Medal* | 55,187 | 55,187 | – | – |
Clad Proof Sets | ||||
| Old Sales | Latest Sales | Gain/ Loss | % Increase | |
| 2022 Proof Set | 399,793 | 399,811 | 18 | 0.00% |
| 2021 Proof Set | 511,763 | 511,767 | 4 | 0.00% |
| 2020 Proof Set* | 464,658 | 464,658 | – | – |
| 2019 Proof Set* | 601,327 | 601,327 | – | – |
| 2018 Proof Set* | 517,081 | 517,081 | – | – |
| 2017 Proof Set* | 568,678 | 568,678 | – | – |
| 2022 American Innovation Dollars Proof Set | 74,946 | 75,066 | 120 | 0.16% |
| 2021 American Innovation Dollars Proof Set | 83,691 | 83,785 | 94 | 0.11% |
| 2020 American Innovation Dollars Proof Set | 107,052 | 107,052 | – | – |
| 2019 American Innovation Dollars Proof Set | 145,633 | 145,712 | 79 | 0.05% |
| 2023 American Women Quarters Proof Set | 42,449 | 42,639 | 190 | 0.45% |
| 2022 American Women Quarters Proof Set* | 42,619 | 42,619 | – | – |
| 2020 America the Beautiful Quarters Proof Set* | 64,242 | 64,242 | – | – |
| 2019 America the Beautiful Quarters Proof Set | 83,083 | 83,139 | 56 | 0.07% |
| 2018 America the Beautiful Quarters Proof Set* | 86,697 | 86,697 | – | – |
Silver Proof Sets | ||||
| Old Sales | Latest Sales | Gain/ Loss | % Increase | |
| 2022 Silver Proof Set | 241,328 | 241,706 | 378 | 0.16% |
| 2021 Silver Proof Set | 300,022 | 300,099 | 77 | 0.03% |
| 2020 Silver Proof Set* | 313,183 | 313,183 | – | – |
| 2019 Silver Proof Set* | 412,708 | 412,708 | – | – |
| 2018 Silver Proof Set* | 332,274 | 332,274 | – | – |
| 2018 Silver Reverse Proof Set* | 199,116 | 199,116 | – | – |
| 2023 American Women Quarters Silver Proof Set | 38,491 | 38,898 | 407 | 1.06% |
| 2022 American Women Quarters Silver Proof Set | 57,649 | 57,649 | – | – |
| 2020 America the Beautiful Quarters Silver Proof Set* | 64,012 | 64,012 | – | – |
| 2019 America the Beautiful Quarters Silver Proof Set* | 78,585 | 78,585 | – | – |
| 2018 America the Beautiful Quarters Silver Proof Set* | 79,301 | 79,301 | – | – |
| 2023 Congratulations Gift Set | 33,184 | 33,916 | 732 | 2.21% |
| 2022 Congratulations Gift Set | 29,710 | 29,710 | – | – |
| 2021 Congratulations Gift Set* | 39,997 | 39,997 | – | – |
| 2020 Congratulations Gift Set* | 24,468 | 24,468 | – | – |
| 2019 Congratulations Gift Set* | 31,638 | 31,638 | – | – |
| 2022 Limited Edition Silver Proof Set | 45,050 | 45,251 | 201 | 0.45% |
| 2021 Limited Edition Silver Proof Set | 48,712 | 48,712 | – | – |
| 2020 Limited Edition Silver Proof Set* | 50,061 | 50,061 | – | – |
US Mint Uncirculated Sets | ||||
| Old Sales | Latest Sales | Gain/ Loss | % Increase | |
| 2022 Uncirculated Mint Set | 230,994 | 231,622 | 628 | 0.27% |
| 2021 Uncirculated Mint Set | 222,435 | 222,592 | 157 | 0.07% |
| 2020 Uncirculated Mint Set* | 211,787 | 211,787 | – | – |
| 2019 Uncirculated Mint Set* | 346,117 | 346,117 | – | – |
| 2018 Uncirculated Mint Set* | 257,536 | 257,536 | – | – |
| 2017 Uncirculated Mint Set* | 286,813 | 286,813 | – | – |
Kids Coin Sets | ||||
| Old Sales | Latest Sales | Gain/ Loss | % Increase | |
| 2019 Youth Coin and Currency Set | 24,644 | 24,704 | 60 | 0.24% |
| 2019 Explore and Discover Coin Set | 41,446 | 41,462 | 16 | 0.04% |
| 2019 Rocketship* | 49,921 | 49,921 | – | – |
| 2014 Coin Discovery Set* | 13,151 | 13,151 | – | – |
Ornaments | ||||
| Old Sales | Latest Sales | Gain/ Loss | % Increase | |
| 2022 U.S. Mint Ornament | 5,344 | 5,348 | 4 | 0.07% |
| 2022 Mighty Minters Ornament | 3,887 | 3,887 | – | – |
| 2022 Maya Angelou Ornament | 2,879 | 2,890 | 11 | 0.38% |
| 2022 Dr. Sally Ride Ornament | 3,001 | 3,006 | 5 | 0.17% |
| 2022 Wilma Mankiller Ornament | 2,094 | 2,095 | 1 | 0.05% |
| 2022 Nina Otero-Warren Ornament | 1,713 | 1,717 | 4 | 0.23% |
| 2022 Anna May Wong Ornament | 3,040 | 3,042 | 2 | 0.07% |
| 2021 Mighty Minters Ornament | 4,821 | 4,821 | – | – |
| 2021 U.S. Mint Ornament | 7,760 | 7,762 | 2 | 0.03% |
| 2020 Mighty Minters Ornament | 4,457 | 4,457 | – | – |
| 2020 U.S. Mint Ornament | 6,483 | 6,484 | 1 | 0.02% |
| 2019 Mighty Minters Ornament | 6,985 | 6,985 | – | – |
| 2019 U.S. Mint Ornament | 11,668 | 11,671 | 3 | 0.03% |
Proof & Reverse Proof Silver Eagles | ||||
| Old Sales | Latest Sales | Gain/ Loss | % Increase | |
| 2022-S Proof Silver Eagle | 199,665 | 199,665 | – | – |
| 2022-S Proof Silver Eagle (Bulk – 40 Coins) | 2,925 | 2,925 | – | – |
| 2023-W Proof Silver Eagle | 424,081 | 424,147 | 66 | 0.02% |
| 2023-W Proof Silver Eagle (Bulk – 40 Coins) | 2,023 | 2,048 | 25 | 1.24% |
| 2022-W Proof Silver Eagle | 496,992 | 496,992 | – | – |
| 2022-W Proof Silver Eagle (Bulk – 40 Coins) | 4,107 | 4,107 | – | – |
| 2021 Reverse Proof American Silver Eagle Two-Coin Set* | 124,822 | 124,822 | – | – |
| 2021-S Proof Silver Eagle, Type 2* | 199,566 | 199,566 | – | – |
| 2021-S Proof Silver Eagle, Type 2 (Bulk – 40 Coins)* | 652 | 652 | – | – |
| 2021-W Proof Silver Eagle, Type 2* | 300,096 | 300,096 | – | – |
| 2021-W Proof Silver Eagle, Type 2 (Bulk – 40 Coins)* | 2,142 | 2,142 | – | – |
| 2021-W Proof Silver Eagle, Type 1* | 299,830 | 299,830 | – | – |
| 2021-W Proof Silver Eagle, Type 1 (Bulk – 40 Coins)* | 686 | 686 | – | – |
Uncirculated Silver Eagles | ||||
| Old Sales | Latest Sales | Gain/ Loss | % Increase | |
| 2023 | 117,035 | 120,632 | 3,597 | 3.07% |
| 2022 | 159,736 | 159,739 | 3 | 0.00% |
| 2022 Bulk 40 | 987 | 987 | – | – |
| 2021* | 174,470 | 174,470 | – | – |
| 2021 Bulk 40* | 324 | 324 | – | – |
2023 Proof American Eagle Gold Coins | ||||
| Old Sales | Latest Sales | Gain/ Loss | % Increase | |
| 1 oz | 6,434 | 6,438 | 4 | 0.06% |
| 1/2 oz | 1,983 | 1,983 | – | – |
| 1/4 oz | 4,449 | 4,453 | 4 | 0.09% |
| 1/10 oz | 9,934 | 10,356 | 422 | 4.25% |
| 4-Coin Set | 9,490 | 8,944 | -546 | -5.75% |
2022 Proof American Eagle Gold Coins | ||||
| Old Sales | Latest Sales | Gain/ Loss | % Increase | |
| 1 oz | 5,912 | 5,912 | – | – |
| 1/2 oz | 1,970 | 1,970 | – | – |
| 1/4 oz | 4,464 | 4,464 | – | – |
| 1/10 oz | 13,804 | 13,804 | – | – |
| 4-Coin Set | 9,904 | 9,904 | – | – |
2021 Proof American Eagle Gold Coins | ||||
| Old Sales | Latest Sales | Gain/ Loss | % Increase | |
| 1/10 oz Two-Coin Proof Set* | 4,985 | 4,985 | – | – |
| 1 oz (Type 2)* | 5,583 | 5,583 | – | – |
| 1/2 oz (Type 2)* | 1,989 | 1,989 | – | – |
| 1/4 oz (Type 2)* | 3,340 | 3,340 | – | – |
| 1/10 oz (Type 2) | 9,871 | 9,871 | – | – |
| 4-Coin Set (Type 2)* | 10,191 | 10,191 | – | – |
| 1 oz (Type 1)* | 4,448 | 4,448 | – | – |
| 1/2 oz (Type 1)* | 1,589 | 1,589 | – | – |
| 1/4 oz (Type 1)* | 2,689 | 2,689 | – | – |
| 1/10 oz (Type 1)* | 7,975 | 7,975 | – | – |
| 4-Coin Set (Type 1)* | 8,176 | 8,176 | – | – |
Uncirculated American Eagle Gold Coins | ||||
| Old Sales | Latest Sales | Gain/ Loss | % Increase | |
| 2023 | – | 3,525 | – | – |
| 2022 | 8,821 | 8,821 | – | – |
| 2021* | 8,914 | 8,914 | – | – |
| 2020* | 6,284 | 6,284 | – | – |
| 2019* | 5,851 | 5,851 | – | – |
| 2018* | 8,518 | 8,518 | – | – |
| 2017* | 5,800 | 5,800 | – | – |
Proof American Buffalo Gold Coins | ||||
| Old Sales | Latest Sales | Gain/ Loss | % Increase | |
| 2023 Proof Gold Buffalo | 10,479 | 10,781 | 302 | 2.88% |
| 2022 Proof Gold Buffalo | 15,937 | 15,937 | – | – |
| 2021 Proof Gold Buffalo | 16,958 | 16,958 | – | – |
| 2020 Proof Gold Buffalo* | 11,887 | 11,887 | – | – |
| 2019 Proof Gold Buffalo* | 14,844 | 14,844 | – | – |
| 2018 Proof Gold Buffalo* | 15,756 | 15,756 | – | – |
| 2017 Proof Gold Buffalo* | 15,810 | 15,810 | – | – |
Proof American Platinum Eagle | ||||
| Old Sales | Latest Sales | Gain/ Loss | % Increase | |
| 2023 | 7,317 | 7,356 | 39 | 0.53% |
| 2022 | 9,873 | 9,881 | 8 | 0.08% |
| 2021 | 9,880 | 9,880 | – | – |
| 2020 | 9,825 | 9,825 | – | – |
| 2019 | 11,268 | 11,268 | – | – |
| 2018 | 15,979 | 15,986 | 7 | 0.04% |
| 2017* | 8,890 | 8,890 | – | – |
American Palladium Eagle | ||||
| Old Sales | Latest Sales | Gain/ Loss | % Increase | |
| 2022-W Reverse Proof | 7,343 | 7,343 | – | – |
| 2021-W Proof | 5,169 | 5,169 | – | – |
| 2020-W Uncirculated | 9,742 | 9,742 | – | – |
| 2019-W Reverse Proof | 18,772 | 18,772 | – | – |
| 2018-W Proof* | 14,986 | 14,986 | – | – |
Presidential Silver Medals | ||||
| Old Sales | Latest Sales | Gain/ Loss | % Increase | |
| 2023 Abraham Lincoln Presidential Silver Medal | 16,266 | 16,474 | 208 | 1.28% |
| 2023 James Buchanan Presidential Silver Medal | 11,690 | 11,733 | 43 | 0.37% |
| 2021 Franklin Pierce Presidential Silver Medal | 12,238 | 12,250 | 12 | 0.10% |
| 2022 Millard Fillmore Presidential Silver Medal | 12,416 | 12,424 | 8 | 0.06% |
| 2022 Zachary Taylor Presidential Silver Medal | 12,809 | 12,816 | 7 | 0.05% |
| 2022 James Knox Polk Presidential Silver Medal | 13,040 | 13,048 | 8 | 0.06% |
| 2021 John Tyler Presidential Silver Medal | 13,462 | 13,466 | 4 | 0.03% |
| 2021 William Henry Harrison Presidential Silver Medal | 13,396 | 13,405 | 9 | 0.07% |
| 2021 Martin Van Buren Presidential Silver Medal | 13,536 | 13,540 | 4 | 0.03% |
| 2020 Andrew Jackson Presidential Silver Medal | 16,399 | 16,409 | 10 | 0.06% |
| 2019 John Quincy Adams Presidential Silver Medal | 14,538 | 14,541 | 3 | 0.02% |
| 2019 James Monroe Presidential Silver Medal | 15,052 | 15,060 | 8 | 0.05% |
| 2019 James Madison Presidential Silver Medal | 16,574 | 16,592 | 18 | 0.11% |
| 2019 Thomas Jefferson Presidential Silver Medal | 23,649 | 23,692 | 43 | 0.18% |
| 2018 George Washington Presidential Silver Medal | 34,369 | 34,428 | 59 | 0.17% |
| 2018 John Adams Presidential Silver Medal | 23,319 | 23,333 | 14 | 0.06% |
American Innovation Reverse Proof Sets | ||||
| Old Sales | Latest Sales | Gain/ Loss | % Increase | |
| 2022 | 47,783 | 47,859 | 76 | 0.16% |
| 2021 | 49,529 | 49,529 | – | – |
2023 American Innovation Dollars – Louisiana | ||||
| Old Sales | Latest Sales | Gain/ Loss | % Increase | |
| 25-coin roll set (P) | 7,520 | 7,572 | 52 | 0.69% |
| 25-coin roll set (D) | 6,849 | 6,893 | 44 | 0.64% |
| 100-coin bag (P) | 2,089 | 2,104 | 15 | 0.72% |
| 100-coin bag (D) | 2,033 | 2,052 | 19 | 0.93% |
2023 American Innovation Dollars – Ohio | ||||
| Old Sales | Latest Sales | Gain/ Loss | % Increase | |
| 25-coin roll set (P) | 7,947 | 7,950 | 3 | 0.04% |
| 25-coin roll set (D) | 6,911 | 6,912 | 1 | 0.01% |
| 100-coin bag (P) | 2,567 | 2,580 | 13 | 0.51% |
| 100-coin bag (D) | 2,382 | 2,396 | 14 | 0.59% |
2022 American Innovation Dollars – Tennessee | ||||
| Old Sales | Latest Sales | Gain/ Loss | % Increase | |
| 25-coin roll set (P) | 7,009 | 7,009 | – | – |
| 25-coin roll set (D) | 7,006 | 7,006 | – | – |
| 100-coin bag (P) | 2,770 | 2,770 | – | – |
| 100-coin bag (D) | 2,771 | 2,771 | – | – |
2022 American Innovation Dollars – Kentucky | ||||
| Old Sales | Latest Sales | Gain/ Loss | % Increase | |
| 25-coin roll set (P) | 7,004 | 7,004 | – | – |
| 25-coin roll set (D) | 6,976 | 6,978 | 2 | 0.03% |
| 100-coin bag (P) | 2,768 | 2,768 | – | – |
| 100-coin bag (D) | 2,778 | 2,778 | – | – |
2022 American Innovation Dollars – Vermont | ||||
| Old Sales | Latest Sales | Gain/ Loss | % Increase | |
| 25-coin roll set (P) | 7,023 | 7,023 | – | – |
| 25-coin roll set (D) | 7,011 | 7,011 | – | – |
| 100-coin bag (P) | 2,787 | 2,787 | – | – |
| 100-coin bag (D) | 2,775 | 2,775 | – | – |
2022 American Innovation Dollars – Rhode Island | ||||
| Old Sales | Latest Sales | Gain/ Loss | % Increase | |
| 25-coin roll set (P) | 7,010 | 7,010 | – | – |
| 25-coin roll set (D) | 7,007 | 7,007 | – | – |
| 100-coin bag (P) | 2,788 | 2,788 | – | – |
| 100-coin bag (D) | 2,786 | 2,786 | – | – |
2021 American Innovation Dollars – North Carolina | ||||
| Old Sales | Latest Sales | Gain/ Loss | % Increase | |
| 25-coin roll set (P) | 6,985 | 6,985 | – | – |
| 25-coin roll set (D) | 6,999 | 6,999 | – | – |
| 100-coin bag (P) | 2,785 | 2,785 | – | – |
| 100-coin bag (D) | 2,787 | 2,787 | – | – |
2021 American Innovation Dollars – New York | ||||
| Old Sales | Latest Sales | Gain/ Loss | % Increase | |
| 25-coin roll set (P) | 6,986 | 6,986 | – | – |
| 25-coin roll set (D) | 6,989 | 6,989 | – | – |
| 100-coin bag (P) | 2,766 | 2,766 | – | – |
| 100-coin bag (D) | 2,764 | 2,764 | – | – |
2021 American Innovation Dollars – Virginia | ||||
| Old Sales | Latest Sales | Gain/ Loss | % Increase | |
| 25-coin roll set (P) | 6,984 | 6,984 | – | – |
| 25-coin roll set (D) | 6,969 | 6,969 | – | – |
| 100-coin bag (P) | 2,795 | 2,795 | – | – |
| 100-coin bag (D) | 2,778 | 2,778 | – | – |
2021 American Innovation Dollars – New Hampshire | ||||
| Old Sales | Latest Sales | Gain/ Loss | % Increase | |
| 25-coin roll set (P) | 6,997 | 6,997 | – | – |
| 25-coin roll set (D) | 7,004 | 7,004 | – | – |
| 100-coin bag (P) | 2,789 | 2,789 | – | – |
| 100-coin bag (D) | 2,787 | 2,787 | – | – |
2020 American Innovation Dollars – South Carolina | ||||
| Old Sales | Latest Sales | Gain/ Loss | % Increase | |
| Reverse Proof (S) | 40,554 | 40,581 | 27 | 0.07% |
| 25-coin roll set (P) | 6,378 | 6,378 | – | – |
| 25-coin roll set (D) | 6,399 | 6,399 | – | – |
| 100-coin bag (P) | 2,734 | 2,734 | – | – |
| 100-coin bag (D) | 2,378 | 2,378 | – | – |
2020 American Innovation Dollars – Maryland | ||||
| Old Sales | Latest Sales | Gain/ Loss | % Increase | |
| Reverse Proof (S) | 49,684 | 49,686 | 2 | 0.00% |
| 25-coin roll set (P) | 6,493 | 6,493 | – | – |
| 25-coin roll set (D) | 6,471 | 6,471 | – | – |
| 100-coin bag (P) | 2,725 | 2,725 | – | – |
| 100-coin bag (D) | 2,737 | 2,737 | – | – |
2020 American Innovation Dollars – Massachusetts | ||||
| Old Sales | Latest Sales | Gain/ Loss | % Increase | |
| Reverse Proof (S) | 47,438 | 47,470 | 32 | 0.07% |
| 25-coin roll set (P) | 6,486 | 6,486 | – | – |
| 25-coin roll set (D) | 6,481 | 6,481 | – | – |
| 100-coin bag (P) | 2,746 | 2,746 | – | – |
| 100-coin bag (D) | 2,744 | 2,744 | – | – |
2020 American Innovation Dollars – Connecticut | ||||
| Old Sales | Latest Sales | Gain/ Loss | % Increase | |
| Reverse Proof (S) | 46,160 | 46,183 | 23 | 0.05% |
| 25-coin roll set (P) | 6,496 | 6,496 | – | – |
| 25-coin roll set (D) | 6,425 | 6,425 | – | – |
| 100-coin bag (P) | 2,736 | 2,736 | – | – |
| 100-coin bag (D) | 2,747 | 2,747 | – | – |
2019 American Innovation Dollars – Georgia | ||||
| Old Sales | Latest Sales | Gain/ Loss | % Increase | |
| Reverse Proof (S) | 46,370 | 46,400 | 30 | 0.06% |
| 25-coin roll set (P) | 7,763 | 7,767 | 4 | 0.05% |
| 25-coin roll set (D) | 7,244 | 7,248 | 4 | 0.06% |
| 100-coin bag (P) | 3,297 | 3,301 | 4 | 0.12% |
| 100-coin bag (D) | 3,181 | 3,181 | – | – |
2019 American Innovation Dollars – New Jersey | ||||
| Old Sales | Latest Sales | Gain/ Loss | % Increase | |
| Reverse Proof (S) | 49,799 | 49,834 | 35 | 0.07% |
| 25-coin roll set (P) | 8,661 | 8,667 | 6 | 0.07% |
| 25-coin roll set (D) | 7,727 | 7,735 | 8 | 0.10% |
| 100-coin bag (P) | 3,762 | 3,766 | 4 | 0.11% |
| 100-coin bag (D) | 3,389 | 3,392 | 3 | 0.09% |
2019 American Innovation Dollars – Pennsylvania | ||||
| Old Sales | Latest Sales | Gain/ Loss | % Increase | |
| Reverse Proof (S) | 54,239 | 54,273 | 34 | 0.06% |
| 25-coin roll set (P) | 9,862 | 9,872 | 10 | 0.10% |
| 25-coin roll set (D) | 8,187 | 8,191 | 4 | 0.05% |
| 100-coin bag (P) | 3,385 | 3,391 | 6 | 0.18% |
| 100-coin bag (D) | 2,906 | 2,907 | 1 | 0.03% |
2019 American Innovation Dollars – Delaware | ||||
| Old Sales | Latest Sales | Gain/ Loss | % Increase | |
| Reverse Proof (S) | 69,533 | 69,581 | 48 | 0.07% |
| 25-coin roll set (P) | 8,785 | 8,788 | 3 | 0.03% |
| 25-coin roll set (D) | 8,125 | 8,129 | 4 | 0.05% |
| 100-coin bag (P) | 3,089 | 3,097 | 8 | 0.26% |
| 100-coin bag (D) | 3,270 | 3,275 | 5 | 0.15% |
2018 American Innovation Dollars | ||||
| Old Sales | Latest Sales | Gain/ Loss | % Increase | |
| Reverse Proof (S)* | 74,720 | 74,720 | – | – |
| Proof Coin (S) | 251,049 | 251,149 | 100 | 0.04% |
| 25-coin roll set (P) | 21,933 | 21,945 | 12 | 0.05% |
| 25-coin roll set (D) | 24,869 | 24,881 | 12 | 0.05% |
| 100-coin bag (P)* | 2,935 | 2,935 | – | – |
| 100-coin bag (D)* | 2,954 | 2,954 | – | – |
George H.W. Bush Coin & Chronicles Set | ||||
| Old Sales | Latest Sales | Gain/ Loss | % Increase | |
| $1 Coin & Set | 11,048 | 11,056 | 8 | 0.07% |
2020 Bush Presidential $1 Coin & First Spouse Medal Set | ||||
| Old Sales | Latest Sales | Gain/ Loss | % Increase | |
| $1 Coin & Set | 9,876 | 9,876 | – | – |
2020 George H.W. Bush Presidential $1 Coins | ||||
| Old Sales | Latest Sales | Gain/ Loss | % Increase | |
| 25-coin roll (P) | 24,532 | 24,577 | 45 | 0.18% |
| 25-coin roll (D) | 21,243 | 21,277 | 34 | 0.16% |
| 100-coin bag (P) | 2,695 | 2,695 | – | – |
| 100-coin bag (D) | 2,098 | 2,098 | – | – |
| 250-coin bag (P) | 2,564 | 2,572 | 8 | 0.31% |
| 250-coin bag (D) | 4,106 | 4,115 | 9 | 0.22% |
Native American Dollar Rolls | ||||
| Old Sales | Latest Sales | Gain/ Loss | % Increase | |
| 2023-P Native American $1 25 Coin Roll | 12,339 | 12,469 | 130 | 1.05% |
| 2023-D Native American $1 25 Coin Roll | 11,756 | 11,872 | 116 | 0.99% |
| 2023-P Native American $1 100-Coin Bag | 1,621 | 1,638 | 17 | 1.05% |
| 2023-D Native American $1 100-Coin Bag | 1,603 | 1,617 | 14 | 0.87% |
| 2023-P Native American $1 250-Coin Box | 955 | 969 | 14 | 1.47% |
| 2023-D Native American $1 250-Coin Box | 1,105 | 1,116 | 11 | 1.00% |
| 2022-P Native American $1 25 Coin Roll | 13,995 | 13,995 | – | – |
| 2022-D Native American $1 25 Coin Roll | 13,915 | 13,915 | – | – |
| 2022-P Native American $1 100-Coin Bag | 1,699 | 1,699 | – | – |
| 2022-D Native American $1 100-Coin Bag | 1,613 | 1,613 | – | – |
| 2022-P Native American $1 250-Coin Box | 1,698 | 1,698 | – | – |
| 2022-D Native American $1 250-Coin Box | 1,699 | 1,699 | – | – |
Kennedy Half Dollar Rolls | ||||
| Old Sales | Latest Sales | Gain/ Loss | % Increase | |
| 2023-dated 200-coin bag (P&D) | 7,737 | 7,825 | 88 | 1.14% |
| 2023-dated 2-roll set (P&D) | 24,816 | 25,389 | 573 | 2.31% |
| 2022-dated 200-coin bag (P&D) | 10,998 | 10,998 | – | – |
| 2022-dated 2-roll set (P&D) | 21,925 | 21,925 | – | – |
| 2021-dated 200-coin bag (P&D) | 9,968 | 9,968 | – | – |
| 2021-dated 2-roll set (P&D) | 21,990 | 21,990 | – | – |
| 2020-dated 200-coin bag (P&D) | 11,776 | 11,776 | – | – |
| 2020-dated 2-roll set (P&D) | 24,312 | 24,312 | – | – |
| 2019-dated 200-coin bag (P&D)* | 11,534 | 11,534 | – | – |
| 2019-dated 2-roll set (P&D)* | 24,132 | 24,132 | – | – |
2023 Edith Kanakaʻole Quarters | ||||
| Old Sales | Latest Sales | Gain/ Loss | % Increase | |
| Three-Roll Set | 12,567 | 12,567 | – | – |
| 100-Coin Bag (P) | 6,286 | 6,322 | 36 | 0.57% |
| 100-Coin Bag (D) | 4,087 | 4,115 | 28 | 0.69% |
| Two-Roll Set | 4,691 | 4,775 | 84 | 1.79% |
2023 Bessie Coleman Quarters | ||||
| Old Sales | Latest Sales | Gain/ Loss | % Increase | |
| Three-Roll Set | 12,504 | 12,503 | -1 | -0.01% |
| 100-Coin Bag (P) | 5,041 | 5,061 | 20 | 0.40% |
| 100-Coin Bag (D) | 4,573 | 4,585 | 12 | 0.26% |
| Two-Roll Set | 5,149 | 5,174 | 25 | 0.49% |
2022 Anna May Wong Quarters | ||||
| Old Sales | Latest Sales | Gain/ Loss | % Increase | |
| Three-Roll Set | 7,617 | 7,617 | – | – |
| 100-Coin Bag (P) | 1,860 | 1,860 | – | – |
| 100-Coin Bag (D) | 1,858 | 1,858 | – | – |
| Two-Roll Set | 5,936 | 5,936 | – | – |
2022 Nina Otero-Warren Quarters | ||||
| Old Sales | Latest Sales | Gain/ Loss | % Increase | |
| Three-Roll Set | 7,639 | 7,639 | – | – |
| 100-Coin Bag (P) | 1,852 | 1,852 | – | – |
| 100-Coin Bag (D) | 1,853 | 1,853 | – | – |
| Two-Roll Set | 5,879 | 5,879 | – | – |
2022 Wilma Mankiller Quarters | ||||
| Old Sales | Latest Sales | Gain/ Loss | % Increase | |
| Three-Roll Set | 7,616 | 7,616 | – | – |
| 100-Coin Bag (P) | 1,848 | 1,848 | – | – |
| 100-Coin Bag (D) | 1,822 | 1,822 | – | – |
| Two-Roll Set | 5,909 | 5,909 | – | – |
2022 Dr. Sally Ride Quarters | ||||
| Old Sales | Latest Sales | Gain/ Loss | % Increase | |
| Three-Roll Set | 7,603 | 7,603 | – | – |
| 100-Coin Bag (P) | 1,853 | 1,854 | 1 | 0.05% |
| 100-Coin Bag (D) | 1,852 | 1,852 | – | – |
| Two-Roll Set | 5,924 | 5,926 | 2 | 0.03% |
2022 Maya Angelou Quarters | ||||
| Old Sales | Latest Sales | Gain/ Loss | % Increase | |
| Three-Roll Set | 7,588 | 7,588 | – | – |
| 100-Coin Bag (P) | 1,858 | 1,858 | – | – |
| 100-Coin Bag (D) | 1,861 | 1,861 | – | – |
| Two-Roll Set | 5,940 | 5,940 | – | – |


