Supported by silver that surged above $28 an ounce, demand picked up last week for United States Mint products made from the precious metal.
Nine of the Mint’s eleven most sold products were silver coins or silver sets. Four of those were five-ounce coins from last year. Their $154.95 price suddenly looked like a bargain.
Weekly U.S. Mint Top Sellers
Here’s the listing of the U.S. Mint’s most popular numismatic products for the week ended Aug. 9:
- 2020-W Uncirculated Silver Eagle (+8,794 to 116,064)
- 2020-W Proof Silver Eagle (+7,541 to 324,236)
- 2020 Proof Set (+5,517 to 326,349)
- 2020 Silver Proof Set (+4,604 to 249,552)
- 2019 Silver Proof Set (+2,152 to 407,497)
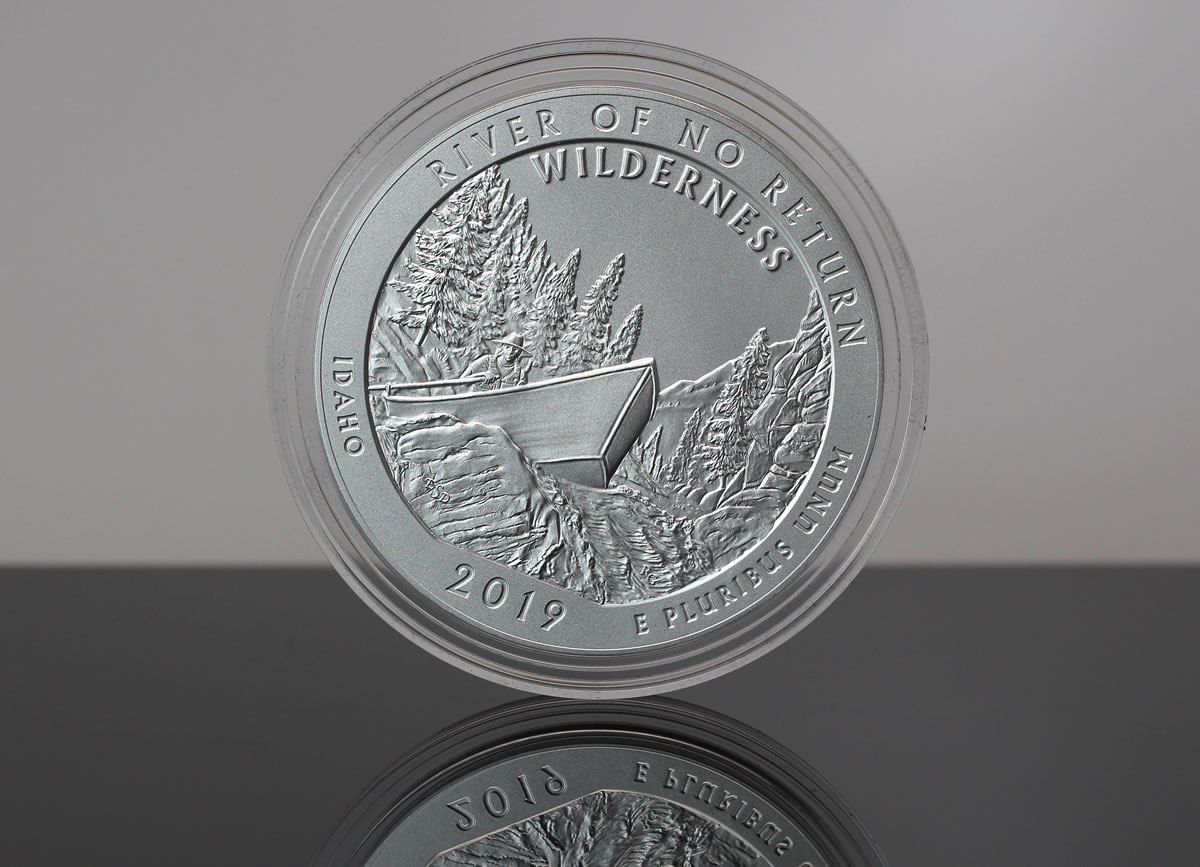
- 2019-P River of No Return 5 Ounce Silver Uncirculated Coin (+1,971 to 16,419)
- 2019-S Reverse Proof Connecticut American Innovation Dollar (+1,803 to 29,058)
- 2019-P American Memorial Five Ounce Silver Uncirculated Coin (+1,203 to 16,115)
- 2019 America the Beautiful Quarters Silver Proof Set (+917 to 75,585)
- 2019-P Lowell Five Ounce Silver Uncirculated Coin (+876 to 16,480)
- 2019-P San Antonio Missions Five Ounce Silver Uncirculated Coin (+776 to 16,039)
In its latest report, the U.S. Mint published sales data for 162 numismatic products. Eighty-one of them outperformed their prior weekly gains compared to 62 previously. Eight products increased by more than 1,000 units compared to 6 in the last report.
In addition, 7 products saw their sales reduced just like last time. One saw a very large reduction — the 2020 Basketball Kids Set dropped 1,549 to 19,255.
US Mint Sales: Numismatic Products
Below are tables showing the latest available sales for U.S. Mint numismatic products. The sales period covers from Aug. 3 to 9. Products with an asterisk (*) are no longer available or had no reported sales.
American Liberty Products |
||||
| Old Sales |
Latest Sales |
Gain/ Loss |
% Increase |
|
| 2019-W $100 American Liberty Gold Coin | 9,726 | 9,811 | 85 | 0.87% |
| 2019-P American Liberty Silver Medal | 39,353 | 40,106 | 753 | 1.91% |
| 2018-W $10 American Liberty Gold Coin | 34,428 | 34,598 | 170 | 0.49% |
| 2017 American Liberty Silver Four-Medal Set* | 32,647 | 32,647 | – | – |
| 2017-S Enhanced Uncirculated Coin Set* | 210,419 | 210,419 | – | – |
| 2017-W $100 American Liberty Gold Coin | 32,085 | 32,141 | 56 | 0.17% |
| 2017-P Proof American Liberty Silver Medal* | 55,187 | 55,187 | – | – |
2020 Basketball Hall of Fame Commemorative Coins |
||||
| Old Sales |
Latest Sales |
Gain/ Loss |
% Increase |
|
| 2020-W Proof $5 Basketball Gold Coin | 7,221 | 7,252 | 31 | 0.43% |
| 2020-W Uncirculated $5 Basketball Gold Coin | 2,942 | 2,968 | 26 | 0.88% |
| 2020-P Proof Basketball Silver Dollar | 61,365 | 61,688 | 323 | 0.53% |
| 2020-P Uncirculated Basketball Silver Dollar | 19,041 | 19,152 | 111 | 0.58% |
| 2020-S Proof Basketball Half Dollar | 24,529 | 24,647 | 118 | 0.48% |
| 2020-D Uncirculated Basketball Half Dollar | 12,541 | 12,600 | 59 | 0.47% |
| 2020 Basketball Kids Set | 20,804 | 19,255 | -1,549 | -7.45% |
2019 American Legion Commemorative Coins |
||||
| Old Sales |
Latest Sales |
Gain/ Loss |
% Increase |
|
| 2019 American Legion Gold Coin and Emblem Print* | 277 | 277 | – | – |
| 2019 American Legion Silver Dollar and Emblem Print* | 1,788 | 1,788 | – | – |
| 2019 American Legion 50c and Emblem Print* | 1,026 | 1,026 | – | – |
| 2019 American Legion Silver Dollar and Medal Set* | 9,888 | 9,888 | – | – |
| 2019-W Proof $5 American Legion Gold Coin* | 3,190 | 3,190 | – | – |
| 2019-W Uncirculated $5 American Legion Gold Coin* | 2,927 | 2,927 | – | – |
| 2019-P Proof American Legion Silver Dollar* | 44,018 | 44,018 | – | – |
| 2019-P Uncirculated American Legion Silver Dollar* | 13,789 | 13,789 | – | – |
| 2019-S Proof American Legion Half Dollar* | 18,811 | 18,811 | – | – |
| 2019-D Uncirculated American Legion Half Dollar* | 11,430 | 11,430 | – | – |
| 2019 American Legion Three-Coin Proof Set* | 7,451 | 7,451 | – | – |
2019 Apollo 11 Commemorative Coins |
||||
| Old Sales |
Latest Sales |
Gain/ Loss |
% Increase |
|
| 2019-W Proof $5 Gold Coin & Intaglio Print* | 1,162 | 1,162 | – | – |
| 2019-P Proof Apollo 11 Silver Dollar & Intaglio Print* | 4,980 | 4,980 | – | – |
| 2019-W Proof $5 Apollo 11 Gold Coin* | 32,862 | 32,862 | – | – |
| 2019-W Uncirculated $5 Apollo 11 Gold Coin* | 12,035 | 12,035 | – | – |
| 2019-P Proof Apollo 11 Silver Dollar* | 218,995 | 218,995 | – | – |
| 2019-P Uncirculated Apollo 11 Silver Dollar* | 59,700 | 59,700 | – | – |
| 2019-S Proof Apollo 11 Half Dollar* | 66,822 | 66,822 | – | – |
| 2019-D Uncirculated Apollo 11 Half Dollar* | 41,742 | 41,742 | – | – |
| 2019-S Proof Apollo 11 Half Dollar Set* | 99,998 | 99,998 | – | – |
| 2019-P Proof Apollo 11 Five Ounce Silver Coin* | 68,301 | 68,301 | – | – |
Clad Proof Set |
||||
| Old Sales |
Latest Sales |
Gain/ Loss |
% Increase |
|
| 2020 Proof Set | 320,832 | 326,349 | 5,517 | 1.72% |
| 2019 Proof Set | 582,467 | 582,858 | 391 | 0.07% |
| 2018 Proof Set* | 517,081 | 517,081 | – | – |
| 2017 Proof Set* | 568,678 | 568,678 | – | – |
| 2019 American Innovation Dollars Proof Set | 103,999 | 104,370 | 371 | 0.36% |
|
2020 America the Beautiful Quarters Proof Set |
55,332 | 55,716 | 384 | 0.69% |
| 2019 America the Beautiful Quarters Proof Set | 73,027 | 73,072 | 45 | 0.06% |
| 2018 America the Beautiful Quarters Proof Set* | 86,697 | 86,697 | – | – |
| 2020 Happy Birthday Gift Set | 13,733 | 13,960 | 227 | 1.65% |
| 2019 Happy Birthday Gift Set | 18,280 | 18,297 | 17 | 0.09% |
| 2018 Happy Birthday Gift Set* | 17,719 | 17,719 | – | – |
| 2020 Birth Gift Set | 16,654 | 17,051 | 397 | 2.38% |
| 2019 Birth Gift Set | 29,392 | 29,440 | 48 | 0.16% |
| 2018 Birth Gift Set | 32,638 | 32,670 | 32 | 0.10% |
Silver Proof Set |
||||
| Old Sales |
Latest Sales |
Gain/ Loss |
% Increase |
|
| 2020 Silver Proof Set | 244,948 | 249,552 | 4,604 | 1.88% |
| 2019 Silver Proof Set | 405,345 | 407,497 | 2,152 | 0.53% |
| 2018 Silver Proof Set* | 332,274 | 332,274 | – | – |
| 2018 Silver Reverse Proof Set* | 199,116 | 199,116 | – | – |
| 2020 America the Beautiful Quarters Silver Proof Set | 57,916 | 58,465 | 549 | 0.95% |
| 2019 America the Beautiful Quarters Silver Proof Set | 74,668 | 75,585 | 917 | 1.23% |
| 2018 America the Beautiful Quarters Silver Proof Set* | 79,301 | 79,301 | – | – |
| 2020 Congratulations Gift Set | 24,445 | 24,445 | – | – |
| 2019 Congratulations Gift Set | 29,137 | 29,376 | 239 | 0.82% |
| 2019 Limited Edition Silver Proof Set* | 47,404 | 47,404 | – | – |
| 2018 Limited Edition Silver Proof Set* | 49,479 | 49,479 | – | – |
US Mint Uncirculated Sets |
||||
| Old Sales |
Latest Sales |
Gain/ Loss |
% Increase |
|
| 2019 Native American $1 Coin and Currency Set | 46,985 | 46,985 | – | – |
| 2019 Uncirculated Mint Set | 334,193 | 334,909 | 716 | 0.21% |
| 2018 Uncirculated Mint Set* | 257,536 | 257,536 | – | – |
| 2017 Uncirculated Mint Set* | 286,813 | 286,813 | – | – |
Kids Coin Sets |
||||
| Old Sales |
Latest Sales |
Gain/ Loss |
% Increase |
|
| 2019 Youth Coin and Currency Set | 10,043 | 10,150 | 107 | 1.07% |
| 2019 Explore and Discover Coin Set | 33,565 | 33,620 | 55 | 0.16% |
| 2019 Rocketship* | 49,921 | 49,921 | – | – |
| 2014 Coin Discovery Set* | 13,151 | 13,151 | – | – |
Ornaments |
||||
| Old Sales |
Latest Sales |
Gain/ Loss |
% Increase |
|
| 2019 Mighty Minters Ornament | 4,509 | 4,511 | 2 | 0.04% |
| 2019 U.S. Mint Ornament | 7,878 | 7,885 | 7 | 0.09% |
Proof Silver Eagles |
||||
| Old Sales |
Latest Sales |
Gain/ Loss |
% Increase |
|
| 2020-W Proof Silver Eagle | 316,695 | 324,236 | 7,541 | 2.38% |
| 2020-W Proof Silver Eagle (Bulk – 40 Coins) | 600 | 600 | – | – |
| 2019-S Enhanced Reverse Proof Proof Silver Eagle* | 29,707 | 29,795 | 88 | 0.30% |
| 2019-S Proof Silver Eagle | 146,736 | 146,736 | – | – |
| 2019-S Proof Silver Eagle (Bulk – 40 Coins)* | 137 | 137 | – | – |
| 2019 Pride of Nations Two-Coin Set | 99,675 | 99,675 | – | – |
| 2019-W Proof Silver Eagle* | 345,380 | 345,380 | – | – |
| 2019-W Proof Silver Eagle (Bulk – 40 Coins)* | 745 | 745 | – | – |
| 2018-S Proof Silver Eagle* | 158,785 | 158,785 | – | – |
| 2018-W Proof Silver Eagle* | 354,025 | 354,025 | – | – |
| 2018-W Proof Silver Eagle (Bulk Pack – 210 Coins)* | 182 | 182 | – | – |
Uncirculated Silver Eagles |
||||
| Old Sales |
Latest Sales |
Gain/ Loss |
% Increase |
|
| 2020 | 107,270 | 116,064 | 8,794 | 8.20% |
| 2020 Bulk 40* | 15 | 15 | – | – |
| 2019 | 138,146 | 138,146 | – | – |
| 2019 Bulk 40* | 66 | 66 | – | – |
| 2018* | 138,947 | 138,947 | – | – |
| 2017* | 176,739 | 176,739 | – | – |
2020 Proof American Eagle Gold Coins |
||||
| Old Sales |
Latest Sales |
Gain/ Loss |
% Increase |
|
| 1 oz | 4,233 | 4,389 | 156 | 3.69% |
| 1/2 oz | 1,750 | 1,933 | 183 | 10.46% |
| 1/4 oz | 2,452 | 2,581 | 129 | 5.26% |
| 1/10 oz | 8,271 | 8,854 | 583 | 7.05% |
| 4-Coin Set | 6,335 | 6,395 | 60 | 0.95% |
2019 Proof American Eagle Gold Coins |
||||
| Old Sales |
Latest Sales |
Gain/ Loss |
% Increase |
|
| 1 oz | 5,806 | 5,819 | 13 | 0.22% |
| 1/2 oz* | 1,876 | 1,876 | – | – |
| 1/4 oz* | 3,035 | 3,035 | – | – |
| 1/10 oz* | 10,231 | 10,231 | – | – |
| 4-Coin Set | 7,542 | 7,549 | 7 | 0.09% |
Uncirculated American Eagle Gold Coins |
||||
| Old Sales |
Latest Sales |
Gain/ Loss |
% Increase |
|
| 2019* | 5,851 | 5,851 | – | – |
| 2018* | 8,518 | 8,518 | – | – |
| 2017* | 5,800 | 5,800 | – | – |
Proof American Buffalo Gold Coins |
||||
| Old Sales |
Latest Sales |
Gain/ Loss |
% Increase |
|
| 2020 Proof Gold Buffalo | 9,404 | 9,969 | 565 | 6.01% |
| 2019 Proof Gold Buffalo | 14,830 | 14,830 | – | – |
| 2018 Proof Gold Buffalo* | 15,756 | 15,756 | – | – |
| 2017 Proof Gold Buffalo* | 15,810 | 15,810 | – | – |
Proof American Platinum Eagle |
||||
| Old Sales |
Latest Sales |
Gain/ Loss |
% Increase |
|
| 2020 | 7,197 | 7,296 | 99 | 1.38% |
| 2019 | 10,604 | 10,652 | 48 | 0.45% |
| 2018 | 14,274 | 14,309 | 35 | 0.25% |
| 2017* | 8,890 | 8,890 | – | – |
American Palladium Eagle |
||||
| Old Sales |
Latest Sales |
Gain/ Loss |
% Increase |
|
| 2019-W Reverse Proof | 17,656 | 17,680 | 24 | 0.14% |
| 2018-W Proof* | 14,986 | 14,986 | – | – |
America the Beautiful 5 Oz Silver Coins |
||||
| Old Sales |
Latest Sales |
Gain/ Loss |
% Increase |
|
| 2020-P Weir Farm Silver Uncirculated Coin | 12,129 | 12,399 | 270 | 2.23% |
|
2020-P National Park of American Samoa Silver Uncirculated Coin |
15,777 | 15,776 | -1 | -0.01% |
| 2019-P River of No Return Silver Uncirculated Coin | 14,448 | 16,419 | 1,971 | 13.64% |
| 2019-P San Antonio Missions Silver Uncirculated Coin | 15,263 | 16,039 | 776 | 5.08% |
| 2019-P War In The Pacific Silver Uncirculated Coin | 16,119 | 16,119 | – | – |
| 2019-P American Memorial Park Silver Uncirculated Coin | 14,912 | 16,115 | 1,203 | 8.07% |
| 2019-P Lowell Five Ounce Silver Uncirculated Coin | 15,604 | 16,480 | 876 | 5.61% |
| 2018-P Block Island Silver Coins* | 15,913 | 15,913 | – | – |
| 2018-P Cumberland Island Silver Coins* | 16,377 | 16,377 | – | – |
| 2018-P Voyageurs Silver Coins* | 16,839 | 16,839 | – | – |
| 2018-P Apostle Islands Silver Coins* | 16,802 | 16,802 | – | – |
| 2018-P Pictured Rocks Silver Coins* | 17,773 | 17,773 | – | – |
| 2017-P George Rogers Clark Silver Coins* | 14,731 | 14,731 | – | – |
| 2017-P Ellis Island Silver Coins* | 17,670 | 17,670 | – | – |
| 2017-P Ozark Riverways Silver Coins | 17,694 | 17,694 | – | – |
| 2017-P Frederick Douglass Silver Coins* | 17,678 | 17,678 | – | – |
| 2017-P Effigy Mounds Silver Coins* | 17,251 | 17,251 | – | – |
Presidential Silver Medals |
||||
| Old Sales |
Latest Sales |
Gain/ Loss |
% Increase |
|
| 2020 Andrew Jackson Presidential Silver Medal | 11,404 | 11,469 | 65 | 0.57% |
| 2019 John Quincy Adams Presidential Silver Medal | 11,334 | 11,376 | 42 | 0.37% |
| 2019 James Monroe Presidential Silver Medal | 11,858 | 11,896 | 38 | 0.32% |
| 2019 James Madison Presidential Silver Medal | 12,728 | 12,759 | 31 | 0.24% |
| 2019 Thomas Jefferson Presidential Silver Medal | 16,716 | 16,761 | 45 | 0.27% |
| 2018 George Washington Presidential Silver Medal | 25,065 | 25,112 | 47 | 0.19% |
| 2018 John Adams Presidential Silver Medal | 19,093 | 19,121 | 28 | 0.15% |
2020 American Innovation Dollars – Connecticut |
||||
| Old Sales |
Latest Sales |
Gain/ Loss |
% Increase |
|
| Reverse Proof (S) | 27,255 | 29,058 | 1,803 | 6.62% |
2019 American Innovation Dollars – Georgia |
||||
| Old Sales |
Latest Sales |
Gain/ Loss |
% Increase |
|
| Reverse Proof (S) | 35,377 | 35,623 | 246 | 0.70% |
| 25-coin roll set (P) | 5,827 | 5,850 | 23 | 0.39% |
| 25-coin roll set (D) | 5,574 | 5,594 | 20 | 0.36% |
| 100-coin bag (P) | 2,208 | 2,235 | 27 | 1.22% |
| 100-coin bag (D) | 2,077 | 2,085 | 8 | 0.39% |
2019 American Innovation Dollars – New Jersey |
||||
| Old Sales |
Latest Sales |
Gain/ Loss |
% Increase |
|
| Reverse Proof (S) | 38,936 | 39,171 | 235 | 0.60% |
| 25-coin roll set (P) | 6,282 | 6,297 | 15 | 0.24% |
| 25-coin roll set (D) | 5,861 | 5,876 | 15 | 0.26% |
| 100-coin bag (P) | 2,477 | 2,488 | 11 | 0.44% |
| 100-coin bag (D) | 2,272 | 2,282 | 10 | 0.44% |
2019 American Innovation Dollars – Pennsylvania |
||||
| Old Sales |
Latest Sales |
Gain/ Loss |
% Increase |
|
| Reverse Proof (S) | 44,125 | 44,333 | 208 | 0.47% |
| 25-coin roll set (P) | 6,908 | 6,932 | 24 | 0.35% |
| 25-coin roll set (D) | 6,181 | 6,194 | 13 | 0.21% |
| 100-coin bag (P) | 2,121 | 2,126 | 5 | 0.24% |
| 100-coin bag (D) | 2,079 | 2,083 | 4 | 0.19% |
2019 American Innovation Dollars – Delaware |
||||
| Old Sales |
Latest Sales |
Gain/ Loss |
% Increase |
|
| Reverse Proof (S) | 59,917 | 60,117 | 200 | 0.33% |
| 25-coin roll set (P) | 6,853 | 6,873 | 20 | 0.29% |
| 25-coin roll set (D) | 6,469 | 6,484 | 15 | 0.23% |
| 100-coin bag (P) | 2,176 | 2,180 | 4 | 0.18% |
| 100-coin bag (D) | 2,379 | 2,383 | 4 | 0.17% |
2018 American Innovation Dollars |
||||
| Old Sales |
Latest Sales |
Gain/ Loss |
% Increase |
|
| Reverse Proof (S)* | 74,720 | 74,720 | – | – |
| Proof Coin (S) | 216,491 | 216,781 | 290 | 0.13% |
| 25-coin roll set (P) | 17,568 | 17,597 | 29 | 0.17% |
| 25-coin roll set (D) | 16,544 | 16,562 | 18 | 0.11% |
| 100-coin bag (P)* | 2,935 | 2,935 | – | – |
| 100-coin bag (D)* | 2,954 | 2,954 | – | – |
Native American Dollar Rolls |
||||
| Old Sales |
Latest Sales |
Gain/ Loss |
% Increase |
|
| 2020-dated 25-coin roll set (P) | 12,085 | 12,173 | 88 | 0.73% |
| 2020-dated 25-coin roll set (D) | 11,752 | 11,844 | 92 | 0.78% |
| 2020-dated 100-coin bag (P) | 1,759 | 1,780 | 21 | 1.19% |
| 2020-dated 100-coin bag (D) | 1,872 | 1,890 | 18 | 0.96% |
| 2020-dated 250-coin box (P) | 1,080 | 1,094 | 14 | 1.30% |
| 2020-dated 250-coin box (D) | 1,198 | 1,224 | 26 | 2.17% |
| 2019-dated 25-coin roll set (P) | 16,309 | 16,339 | 30 | 0.18% |
| 2019-dated 25-coin roll set (D) | 15,656 | 15,678 | 22 | 0.14% |
| 2019-dated 100-coin bag (P) | 1,809 | 1,823 | 14 | 0.77% |
| 2019-dated 100-coin bag (D) | 1,746 | 1,755 | 9 | 0.52% |
| 2019-dated 250-coin box (P)* | 1,734 | 1,734 | – | – |
| 2019-dated 250-coin box (D) | 1,927 | 1,949 | 22 | 1.14% |
| 2018-dated 25-coin roll set (P)* | 17,392 | 17,392 | – | – |
| 2018-dated 25-coin roll set (D)* | 16,555 | 16,555 | – | – |
| 2018-dated 100-coin bag (P)* | 1,931 | 1,931 | – | – |
| 2018-dated 100-coin bag (D)* | 1,930 | 1,930 | – | – |
| 2018-dated 250-coin box (P)* | 1,865 | 1,865 | – | – |
| 2018-dated 250-coin box (D)* | 1,874 | 1,874 | – | – |
Kennedy Half Dollar Rolls |
||||
| Old Sales |
Latest Sales |
Gain/ Loss |
% Increase |
|
| 2020-dated 200-coin bag (P&D) | 4,151 | 4,317 | 166 | 4.00% |
| 2020-dated 2-roll set (P&D) | 18,151 | 18,530 | 379 | 2.09% |
| 2019-dated 200-coin bag (P&D) | 9,918 | 10,005 | 87 | 0.88% |
| 2019-dated 2-roll set (P&D) | 23,066 | 23,141 | 75 | 0.33% |
| 2018-dated 200-coin bag (P&D)* | 9,498 | 9,498 | – | – |
| 2018-dated 2-roll set (P&D)* | 22,622 | 22,622 | – | – |
America the Beautiful Quarters Uncirculated Coin Set |
||||
| Old Sales |
Latest Sales |
Gain/ Loss |
% Increase |
|
| 2020 Issue | 24,803 | 24,803 | – | – |
| 2019 Issue | 28,542 | 28,734 | 192 | 0.67% |
| 2018 Issue* | 32,648 | 32,648 | – | – |
| 2017 Issue* | 29,972 | 29,972 | – | – |
America the Beautiful Quarters Circulating Coin Set |
||||
| Old Sales |
Latest Sales |
Gain/ Loss |
% Increase |
|
| 2019 Issue | 21,297 | 21,349 | 52 | 0.24% |
| 2018 Issue | 22,650 | 22,650 | – | – |
| 2017 Issue* | 24,765 | 24,765 | – | – |
| 2016 Issue* | 23,958 | 23,958 | – | – |
America the Beautiful Quarters Three-Coin Sets |
||||
| Old Sales |
Latest Sales |
Gain/ Loss |
% Increase |
|
| Salt River Bay | 11,541 | 11,382 | -159 | -1.38% |
| Weir Farm | 11,378 | 11,520 | 142 | 1.25% |
| National Park of American Samoa | 14,554 | 14,725 | 171 | 1.17% |
| River of No Return | 13,042 | 13,064 | 22 | 0.17% |
| San Antonio Missions | 15,024 | 15,052 | 28 | 0.19% |
| War in Pacific | 15,240 | 15,240 | – | – |
| American Memorial Park | 14,527 | 14,547 | 20 | 0.14% |
| Lowell | 14,671 | 14,695 | 24 | 0.16% |
| Block Island | 13,765 | 13,778 | 13 | 0.09% |
| Cumberland Island | 13,836 | 13,846 | 10 | 0.07% |
| Voyageurs | 14,744 | 14,757 | 13 | 0.09% |
| Apostle Islands | 14,805 | 14,817 | 12 | 0.08% |
| Pictured Rocks* | 15,397 | 15,397 | – | – |
| George Rogers Clark* | 14,133 | 14,133 | – | – |
| Ellis Island* | 16,947 | 16,947 | – | – |
| Ozark Riverways* | 14,912 | 14,912 | – | – |
| Frederick Douglass* | 15,566 | 15,566 | – | – |
| Effigy Mounds* | 14,516 | 14,516 | – | – |
| Fort Moultrie* | 13,306 | 13,306 | – | – |
| Theodore Roosevelt* | 16,072 | 16,072 | – | – |
| Harpers Ferry* | 14,345 | 14,345 | – | – |
| Cumberland Gap* | 14,973 | 14,973 | – | – |
| Shawnee* | 15,474 | 15,474 | – | – |
| Saratoga* | 14,950 | 14,950 | – | – |
| Bombay Hook* | 13,400 | 13,400 | – | – |
| Blue Ridge Parkway* | 17,165 | 17,165 | – | – |
| Kisatchie Set* | 15,196 | 15,196 | – | – |
| Homestead Set* | 16,114 | 16,114 | – | – |
| Everglades Set* | 14,373 | 14,373 | – | – |
| Great Sand Dunes Set* | 14,119 | 14,119 | – | – |
| Arches Three-Coin Set* | 15,859 | 15,859 | – | – |
| Shenandoah Three-Coin Set* | 17,351 | 17,351 | – | – |
| Great Smoky Mountains Set* | 18,588 | 18,588 | – | – |
| Mount Rushmore Quarters Set* | 17,924 | 17,924 | – | – |
| Fort McHenry Quarters Set* | 16,345 | 16,345 | – | – |
| Great Basin Quarters Set* | 15,526 | 15,526 | – | – |
| Perry’s Victory Quarters Set* | 17,643 | 17,643 | – | – |
| White Mountain Quarters Set* | 18,056 | 18,056 | – | – |
| Denali Quarters Set* | 18,193 | 18,193 | – | – |
| Hawaii Volcanoes Quarters Set* | 19,947 | 19,947 | – | – |
| Acadia Quarters Set* | 19,940 | 19,940 | – | – |
| Chaco Culture Quarters Set* | 20,028 | 20,028 | – | – |
| El Yunque Quarters Set* | 19,891 | 19,891 | – | – |
| Chickasaw Quarters Set* | 16,184 | 16,184 | – | – |
| Vicksburg Quarters Set* | 18,095 | 18,095 | – | – |
| Olympic Quarters Set* | 17,718 | 17,718 | – | – |
| Glacier Quarters Set* | 19,046 | 19,046 | – | – |
| Gettysburg Quarters Set* | 22,869 | 22,869 | – | – |
| Mount Hood Quarters Set* | 18,384 | 18,384 | – | – |
| Grand Canyon Quarters Set* | 22,133 | 22,133 | – | – |
| Yosemite Quarters Set* | 22,154 | 22,154 | – | – |
| Yellowstone Quarters Set* | 25,048 | 25,048 | – | – |
| Hot Springs Quarters Set* | 23,203 | 23,203 | – | – |
2020 Salt River Bay Quarters |
||||
| Old Sales |
Latest Sales |
Gain/ Loss |
% Increase |
|
| 100-Coin Bag (S) | 3,094 | 3,156 | 62 | 2.00% |
| 40-Coin Roll (S) | 3,113 | 3,157 | 44 | 1.41% |
| Three-Roll Set | 7,007 | 7,005 | -2 | -0.03% |
| 100-Coin Bag (P) | 1,832 | 1,836 | 4 | 0.22% |
| 100-Coin Bag (D) | 1,848 | 1,834 | -14 | -0.76% |
| Two-Roll Set | 5,043 | 4,883 | -160 | -3.17% |
2020 Weir Farm Quarters |
||||
| Old Sales |
Latest Sales |
Gain/ Loss |
% Increase |
|
| 100-Coin Bag (S) | 3,311 | 3,346 | 35 | 1.06% |
| 40-Coin Roll (S) | 3,685 | 3,732 | 47 | 1.28% |
| Three-Roll Set | 7,485 | 7,580 | 95 | 1.27% |
| 100-Coin Bag (P) | 2,313 | 2,353 | 40 | 1.73% |
| 100-Coin Bag (D) | 2,216 | 2,249 | 33 | 1.49% |
| Two-Roll Set | 5,163 | 5,193 | 30 | 0.58% |
2020 National Park of American Samoa Quarters |
||||
| Old Sales |
Latest Sales |
Gain/ Loss |
% Increase |
|
| 100-Coin Bag (S) | 4,236 | 4,236 | – | – |
| 40-Coin Roll (S) | 3,974 | 3,974 | – | – |
| Three-Roll Set | 8,930 | 8,930 | – | – |
| 100-Coin Bag (P) | 2,456 | 2,456 | – | – |
| 100-Coin Bag (D) | 2,480 | 2,480 | – | – |
| Two-Roll Set | 6,930 | 6,930 | – | – |
2019 River of No Return Quarters |
||||
| Old Sales |
Latest Sales |
Gain/ Loss |
% Increase |
|
| 100-Coin Bag (S) | 3,868 | 3,884 | 16 | 0.41% |
| 40-Coin Roll (S) | 3,962 | 3,961 | -1 | -0.03% |
| Three-Roll Set | 8,249 | 8,260 | 11 | 0.13% |
| 100-Coin Bag (P) | 2,202 | 2,206 | 4 | 0.18% |
| 100-Coin Bag (D) | 2,094 | 2,108 | 14 | 0.67% |
| Two-Roll Set | 5,717 | 5,718 | 1 | 0.02% |
2019 San Antonio Missions Quarters |
||||
| Old Sales |
Latest Sales |
Gain/ Loss |
% Increase |
|
| 100-Coin Bag (S) | 4,164 | 4,186 | 22 | 0.53% |
| 40-Coin Roll (S) | 3,929 | 3,929 | – | – |
| Three-Roll Set | 8,832 | 8,853 | 21 | 0.24% |
| 100-Coin Bag (P) | 2,403 | 2,407 | 4 | 0.17% |
| 100-Coin Bag (D) | 2,275 | 2,281 | 6 | 0.26% |
| Two-Roll Set | 5,979 | 5,982 | 3 | 0.05% |
2019 War In The Pacific Quarters |
||||
| Old Sales |
Latest Sales |
Gain/ Loss |
% Increase |
|
| 100-Coin Bag (S) | 4,203 | 4,203 | – | – |
| 40-Coin Roll (S) | 3,838 | 3,838 | – | – |
| Three-Roll Set | 8,764 | 8,764 | – | – |
| 100-Coin Bag (P) | 2,391 | 2,391 | – | – |
| 100-Coin Bag (D) | 2,291 | 2,291 | – | – |
| Two-Roll Set | 6,050 | 6,050 | – | – |
2019 American Memorial Park Quarters |
||||
| Old Sales |
Latest Sales |
Gain/ Loss |
% Increase |
|
| 100-Coin Bag (S) | 4,114 | 4,114 | – | – |
| 40-Coin Roll (S) | 3,859 | 3,859 | – | – |
| Three-Roll Set | 8,478 | 8,478 | – | – |
| 100-Coin Bag (P)* | 2,455 | 2,455 | – | – |
| 100-Coin Bag (D)* | 2,421 | 2,421 | – | – |
| Two-Roll Set | 6,059 | 6,059 | – | – |
2019 Lowell Quarters |
||||
| Old Sales |
Latest Sales |
Gain/ Loss |
% Increase |
|
| 100-Coin Bag (S)* | 4,006 | 4,006 | – | – |
| 40-Coin Roll (S)* | 3,801 | 3,801 | – | – |
| Three-Roll Set* | 8,596 | 8,596 | – | – |
| 100-Coin Bag (P)* | 2,435 | 2,435 | – | – |
| 100-Coin Bag (D)* | 2,325 | 2,325 | – | – |
| Two-Roll Set* | 6,168 | 6,168 | – | – |


