
Precious metals futures tumbled Monday as the U.S. dollar rallied and investors spurned safe-havens. Milestone settlements lows in gold, silver and platinum ranged from more than one and a half years to nearly ten years.
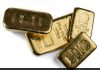
Gold for December delivery declined $20.10, or 1.7%, to settle at $1,198.90 an ounce on the Comex division of the New York Mercantile Exchange. The settlement is the lowest since Jan. 30, 2017, when prices ended at $1,196 an ounce.
Frustrating for the gold and silver market bulls is the fact their metals are getting no benefit from safe-haven demand amid the keener uncertainty in the world marketplace," Jim Wyckoff, a senior analyst at Kitco Metals Inc., said in a report.
Gold futures ranged from a low of $1,198.60 to a high of $1,221.40. They dipped 0.3% lower last week.
Meanwhile, silver for September sank 31.3 cents, or 2.1%, to $14.982 an ounce. The settlement is the weakest since April 4, 2016 when the precious metal ended at $14.911 an ounce.
Silver futures traded between $14.97 and $15.35. They dropped 1.1% last week, registering their ninth straight weekly decline.
In other precious metals futures prices on Monday:
-
October platinum fell $30.10, or 3.6%, to $799.50 an ounce — the lowest since December 2008, ranging from $797 to $831.80.
- Palladium for September delivery lost $20.20, or 2.2%, to $880.90 an ounce, trading between $877.30 and $902.50.
Last week, the two metals logged respective losses of 0.9% and 0.8%.
London Precious Metals Prices
In comparing earlier fixed London gold and silver prices from Friday PM to Monday PM:
- Gold declined $14.05, or 1.2%, to 1,200.35 an ounce.
- Silver fell 19 cents, or 1.2%, to $15.185 an ounce.
LBMA platinum and palladium prices are available on the LBMA’s website with a delay of midnight.
In LBMA results last week, prices for silver moved up 0.1% while those for gold, platinum and palladium moved down 0.2%, 0.5%, and 1%.
US Mint Bullion Sales in 2018
United States Mint bullion products posted gains of 225,000 ounces in American Eagle silver coins and a combined 3,500 ounces in American Eagle and Buffalo gold coins.
Below is a sales breakdown of U.S. Mint bullion products with columns listing the number of coins sold during varying periods.
| US Mint Bullion Sales (# of coins) | |||||
|---|---|---|---|---|---|
| Monday | Last Week | July | August | 2018 Sales | |
| $100 American Eagle 1 Oz Platinum Coin | 0 | 0 | 0 | 0 | 30,000 |
| $50 American Eagle 1 Oz Gold Coin | 2,000 | 6,000 | 31,500 | 8,500 | 127,500 |
| $25 American Eagle 1/2 Oz Gold Coin | 0 | 0 | 1,000 | 0 | 18,000 |
| $10 American Eagle 1/4 Oz Gold Coin | 0 | 0 | 2,000 | 0 | 50,000 |
| $5 American Eagle 1/10 Oz Gold Coin | 0 | 0 | 25,000 | 0 | 150,000 |
| $50 American Buffalo 1 Oz Gold Coin | 1,500 | 9,000 | 24,500 | 11,000 | 89,000 |
| $1 American Eagle 1 Oz Silver Coin | 225,000 | 235,000 | 885,000 | 490,000 | 8,197,500 |
| Pictured Rocks 5 Oz Silver Coin | 0 | 0 | 0 | 0 | 30,000 |
| Apostle Islands 5 Oz Silver Coin | 0 | 0 | 0 | 0 | 30,000 |
| Voyageurs 5 Oz Silver Coin | 0 | 0 | 0 | 0 | 30,000 |