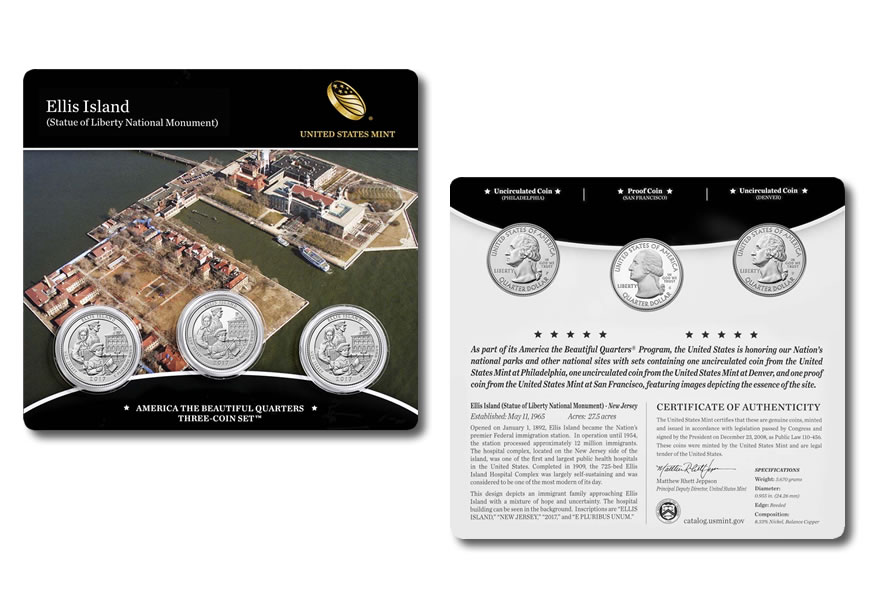
Orders picked up a bit across U.S. Mint collector products, according to the latest round of weekly sales figures. The broader gains were supported by the release of the Ellis Island Three-Coin Set.
Containing an uncirculated quarter from the Philadelphia and Denver Mints and a proof quarter from the San Francisco Mint, the set scored four-day sales of 10,513 for the strongest start among series issues since 2016. This year’s first three sets and last year’s five sets debuted with sales of:
- 9,821 sets for Ozark Riverways in Missouri,
- 9,415 sets for Frederick Douglass National Historic Site in DC,
- 9,413 sets for Effigy Mounds National Monument in Iowa,
- 10,261 sets for the Fort Moultrie in South Carolina,
- 10,030 sets for the Theodore Roosevelt National Park in North Dakota,
- 9,723 sets for Harpers Ferry National Historical Park of West Virginia,
- 9,638 sets for Cumberland Gap National Historical Park of Kentucky, and
- 10,086 sets for Shawnee National Forest of Illinois.
Weekly U.S. Mint Top Sellers
Here’s a showing of the agency’s most popular products for the week ended Sept. 17:
- 2017 Ellis Island Three-Coin Set (+10,513)
- 2017 Silver Proof Set (+10,257 to 245,687)
- 2017 Proof Set (+6,304 to 363,923)
- 2017 Mint Set (+5,033 to 210,068)
- 2017-W Proof Silver Eagle (+3,472 to 310,040)
- 2017-S Enhanced Uncirculated Coin Set (+2,367 to 193,573)
- 2017-P Ellis Island Five Ounce Silver Uncirculated Coin (+967 to 15,609)
- 2016 Mint Set (+826 to 293,013)
- 2017 Uncirculated Silver Eagles (+803 to 123,711)
- 2017-W $50 Uncirculated American Gold Eagle Coin (+677 to 4,499 )
The U.S. Mint published sales data for 300 numismatic products. One hundred and twelve products outperformed their prior weekly gains compared to 53 previously. Not counting the new Ellis Island Three-Coin Set, 5 products increased by more than 1,000 units compared to 6 previously. Four products saw their sales total reduced, matching the previous report.
US Mint Sales: Numismatic Products
Below are tables showing the latest sales for U.S. Mint numismatic products. The sales period covers Sept. 11 to 17. Products with an asterisk (*) are no longer available.
225th Anniversary Products |
||||
| Old Sales |
Latest Sales |
Gain/ Loss |
% Increase |
|
| 2017-S Enhanced Uncirculated Coin Set | 191,206 | 193,573 | 1.24% | |
| 2017-W American Liberty Gold Coin | 24,555 | 24,634 | 79 | 0.32% |
| 2017-P Proof American Liberty Silver Medal | 44,431 | 44,860 | 429 | 0.97% |
2016 Centennial Gold Coins |
||||
| Old Sales |
Latest Sales |
Gain/ Loss |
% Increase |
|
| Gold Walking Liberty Half-Dollar | 64,220 | 64,246 | 26 | 0.04% |
| Gold Standing Liberty Quarter | 90,061 | 90,134 | 73 | 0.08% |
| Gold Mercury Dime* | 124,885 | 124,885 | – | – |
2017 Boys Town Commemorative Coins |
||||
| Old Sales |
Latest Sales |
Gain/ Loss |
% Increase |
|
| $5 Gold Proof | 1,404 | 1,407 | 3 | 0.21% |
| $5 Gold Uncirculated | 2,006 | 2,013 | 7 | 0.35% |
| $1 Silver Proof | 23,169 | 23,299 | 130 | 0.56% |
| $1 Silver Uncirculated | 9,806 | 9,834 | 28 | 0.29% |
| 50c Proof Clad Half-Dollar | 16,168 | 16,218 | 50 | 0.31% |
| 50c Uncirculated Clad Half-Dollar | 14,146 | 14,176 | 30 | 0.21% |
| Three-Coin Proof Set | 5,065 | 5,080 | 15 | 0.30% |
2017 Lions Clubs Commemorative Coins |
||||
| Old Sales |
Latest Sales |
Gain/ Loss |
% Increase |
|
| $1 Silver Proof | 64,991 | 65,097 | 106 | 0.16% |
| $1 Silver Uncirculated | 16,417 | 16,439 | 22 | 0.13% |
2016 NPS Commemorative Coins |
||||
| Old Sales |
Latest Sales |
Gain/ Loss |
% Increase |
|
| $5 Gold Proof* | 4,916 | 4,916 | – | – |
| $5 Gold Uncirculated* | 5,150 | 5,150 | – | – |
| $1 Silver Proof* | 62,719 | 62,719 | – | – |
| $1 Silver Uncirculated* | 20,994 | 20,994 | – | – |
| 50c Proof Clad Half-Dollar* | 40,254 | 40,254 | – | – |
| 50c Uncirculated Clad Half-Dollar* | 21,019 | 21,019 | – | – |
| Three-Coin Proof Set* | 14,590 | 14,590 | – | – |
2016 Mark Twain Commemorative Coins |
||||
| Old Sales |
Latest Sales |
Gain/ Loss |
% Increase |
|
| $5 Gold Proof* | 13,266 | 13,266 | – | – |
| $5 Gold Uncirculated* | 5,695 | 5,695 | – | – |
| $1 Silver Proof* | 78,536 | 78,536 | – | – |
| $1 Silver Uncirculated* | 26,281 | 26,281 | – | – |
Clad Proof Sets |
||||
| Old Sales |
Latest Sales |
Gain/ Loss |
% Increase |
|
| 2017 Proof Set | 357,619 | 363,923 | 6,304 | 1.76% |
| 2016 Proof Set* | 595,184 | 595,184 | – | – |
| 2017 America the Beautiful Quarters Proof Sets | 68,446 | 69,106 | 660 | 0.96% |
| 2016 America the Beautiful Quarters Proof Sets | 89,310 | 89,413 | 103 | 0.12% |
| 2016 Ronald Reagan Coin & Chronicles Set | 45,244 | 45,317 | 73 | 0.16% |
| 2016 Presidential $1 Coin Proof Sets | 227,346 | 227,551 | 205 | 0.09% |
| 2017 Happy Birthday Gift Sets | 14,003 | 14,199 | 196 | 1.40% |
| 2016 Happy Birthday Gift Sets* | 16,884 | 16,884 | – | – |
| 2015 Happy Birthday Gift Sets* | 14,470 | 14,470 | – | – |
| 2014 Happy Birthday Gift Sets | 13,464 | 13,465 | 1 | 0.01% |
| 2013 Happy Birthday Gift Sets | 11,926 | 11,929 | 3 | 0.03% |
| 2017 Birth Gift Sets | 20,962 | 21,291 | 329 | 1.57% |
| 2016 Birth Gift Sets | 29,707 | 29,707 | – | – |
| 2015 Birth Gift Sets* | 34,548 | 34,548 | – | – |
| 2014 Birth Gift Sets | 35,582 | 35,591 | 9 | 0.03% |
| 2013 Birth Gift Sets | 42,177 | 42,181 | 4 | 0.01% |
| 2012 Birth Gift Sets* | 49,703 | 49,703 | – | – |
Silver Proof Sets |
||||
| Old Sales |
Latest Sales |
Gain/ Loss |
% Increase |
|
| 2017 Silver Proof Sets | 235,430 | 245,687 | 10,257 | 4.36% |
| 2016 Silver Proof Sets* | 369,849 | 369,849 | – | – |
| 2015 Silver Proof Sets* | 387,311 | 387,311 | – | – |
| 2017 America the Beautiful Quarters Silver Proof Sets | 72,977 | 73,556 | 579 | 0.79% |
| 2016 America the Beautiful Quarters Silver Proof Sets | 93,739 | 93,853 | 114 | 0.12% |
| 2017 Congratulations Gift Sets* | 74,898 | 74,898 | – | – |
| 2016 Congratulations Gift Sets | 5,966 | 5,966 | – | – |
| 2016 Limited Edition Silver Proof Sets | 44,319 | 44,605 | 286 | 0.65% |
| 2014 Limited Edition Silver Proof Sets* | 42,614 | 42,614 | – | – |
US Mint Uncirculated Sets |
||||
| Old Sales |
Latest Sales |
Gain/ Loss |
% Increase |
|
| 2016 American $1 Coin and Currency Set | 49,081 | 49,171 | 90 | 0.18% |
| 2015 American $1 Coin and Currency Set* | 88,805 | 88,805 | – | – |
| 2017 Uncirculated Mint Set | 205,035 | 210,068 | 5,033 | 2.45% |
| 2016 Uncirculated Mint Set | 292,187 | 293,013 | 826 | 0.28% |
| 2016 Presidential $1 Coin Uncirculated Sets* | 55,047 | 55,047 | – | – |
| 2015 Presidential $1 Coin Uncirculated Sets | 63,258 | 63,304 | 46 | 0.07% |
| 2014 Presidential $1 Coin Uncirculated Sets | 65,512 | 65,538 | 26 | 0.04% |
| 2013 Presidential $1 Coin Uncirculated Sets* | 75,846 | 75,846 | – | – |
| 2012 Presidential $1 Coin Uncirculated Sets* | 99,743 | 99,743 | – | – |
| 2011 Presidential $1 Coin Uncirculated Sets | 86,321 | 86,336 | 15 | 0.02% |
| 2016 Annual Uncirculated Dollar Coin Sets | 19,509 | 19,629 | 120 | 0.62% |
| 2015 Annual Uncirculated Dollar Coin Sets* | 22,691 | 22,691 | – | – |
| 2013 Theodore Roosevelt Presidential Discovery Sets | 10,332 | 10,336 | 4 | 0.04% |
Coin Discovery Set |
||||
| Old Sales |
Latest Sales |
Gain/ Loss |
% Increase |
|
| 2014 | 8,802 | 8,819 | 17 | 0.19% |
Proof Silver Eagles |
||||
| Old Sales |
Latest Sales |
Gain/ Loss |
% Increase |
|
| 2017-W Proof Silver Eagles | 306,568 | 310,040 | 3,472 | 1.13% |
| 2016-W Proof Silver Eagles | 572,209 | 572,536 | 327 | 0.06% |
| 2015-W Proof Silver Eagles* | 699,623 | 699,623 | – | – |
Uncirculated Silver Eagles |
||||
| Old Sales |
Latest Sales |
Gain/ Loss |
% Increase |
|
| 2017 | 122,908 | 123,711 | 803 | 0.65% |
| 2016 | 206,782 | 206,850 | 68 | 0.03% |
| 2015* | 201,188 | 201,188 | – | – |
2017 Proof American Eagle Gold Coins |
||||
| Old Sales |
Latest Sales |
Gain/ Loss |
% Increase |
|
| 1 oz | 6,252 | 6,348 | 96 | 1.54% |
| 1/2 oz | 1,463 | 1,475 | 12 | 0.82% |
| 1/4 oz | 2,314 | 2,364 | 50 | 2.16% |
| 1/10 oz | 9,743 | 9,917 | 174 | 1.79% |
| 4-Coin Set | 8,280 | 8,446 | 166 | 2.00% |
2016 Proof American Eagle Gold Coins |
||||
| Old Sales |
Latest Sales |
Gain/ Loss |
% Increase |
|
| 1 oz | 23,729 | 23,741 | 12 | 0.05% |
| 1/2 oz | 5,743 | 5,754 | 11 | 0.19% |
| 1/4 oz* | 7,135 | 7,135 | – | – |
| 1/10 oz* | 21,629 | 21,629 | – | – |
| 4-Coin Set* | 17,270 | 17,270 | – | – |
Uncirculated American Eagle Gold Coins |
||||
| Old Sales |
Latest Sales |
Gain/ Loss |
% Increase |
|
| 2017 | 3,822 | 4,499 | 677 | 17.71% |
| 2016* | 6,887 | 6,887 | – | – |
Proof American Buffalo Gold Coins |
||||
| Old Sales |
Latest Sales |
Gain/ Loss |
% Increase |
|
| 2017 Proof Gold Buffalo | 13,068 | 13,187 | 119 | 0.91% |
| 2016 Proof Gold Buffalo* | 21,878 | 21,878 | – | – |
Proof American Platinum Eagle |
||||
| Old Sales |
Latest Sales |
Gain/ Loss |
% Increase |
|
| 2017 | 9,038 | 8,992 | -46 | -0.51% |
| 2016* | 9,151 | 9,151 | – | – |
America the Beautiful 5 Oz Silver Coins |
||||
| Old Sales |
Latest Sales |
Gain/ Loss |
% Increase |
|
| 2017-P Ellis Island Silver Coins | 14,642 | 15,609 | 967 | 6.60% |
| 2017-P Ozark Riverways Silver Coins | 14,732 | 14,954 | 222 | 1.51% |
| 2017-P Frederick Douglass Silver Coins | 15,746 | 15,816 | 70 | 0.44% |
| 2017-P Effigy Mounds Silver Coins | 15,804 | 15,841 | 37 | 0.23% |
| 2016-P Fort Moultrie Silver Coins | 17,502 | 17,532 | 30 | 0.17% |
| 2016-P Theodore Roosevelt Silver Coins* | 18,917 | 18,917 | – | – |
| 2016-P Harpers Ferry Silver Coins* | 18,896 | 18,896 | – | – |
| 2016-P Cumberland Gap Silver Coins* | 18,713 | 18,713 | – | – |
| 2016-P Shawnee Silver Coins* | 18,781 | 18,781 | – | – |
| 2015-P Saratoga Silver Coins* | 17,563 | 17,563 | – | – |
| 2015-P Bombay Hook Silver Coins* | 17,309 | 17,309 | – | – |
| 2015-P Blue Ridge Parkway Silver Coins* | 17,461 | 17,461 | – | – |
| 2015-P Kisatchie Silver Coins* | 19,449 | 19,449 | – | – |
| 2015-P Homestead Silver Coins* | 21,283 | 21,286 | – | – |
| 2014-P Everglades Silver Coins* | 22,732 | 22,732 | – | – |
| 2014-P Great Sand Dunes Silver Coins* | 24,103 | 24,103 | – | – |
| 2014-P Arches Silver Coins* | 28,434 | 28,434 | – | – |
| 2014-P Shenandoah Silver Coins* | 28,451 | 28,451 | – | – |
| 2014-P Great Smoky Mountains Silver Coins* | 24,710 | 24,710 | – | – |
| 2013-P White Mountain Silver Coins* | 20,530 | 20,530 | – | – |
| 2013-P Perry’s Victory Silver Coins* | 17,707 | 17,707 | – | – |
| 2013-P Great Basin Silver Coins* | 17,792 | 17,792 | – | – |
| 2013-P Fort McHenry Silver Coins* | 19,802 | 19,802 | – | – |
| 2013-P Mount Rushmore Silver Coins* | 23,547 | 23,547 | – | – |
First Spouse Gold Coins |
||||
| Old Sales |
Latest Sales |
Gain/ Loss |
% Increase |
|
| Nancy Reagan Proof (2016) | 3,427 | 3,440 | 13 | 0.38% |
| Nancy Reagan Uncirculated (2016) | 1,915 | 1,919 | 4 | 0.21% |
| Betty Ford Proof (2016) | 2,393 | 2,403 | 10 | 0.42% |
| Betty Ford Uncirculated (2016) | 1,656 | 1,660 | 4 | 0.24% |
| Pat Nixon Proof (2016) | 2,581 | 2,590 | 9 | 0.35% |
| Pat Nixon Uncirculated (2016) | 1,669 | 1,678 | 9 | 0.54% |
| Lady Bird Johnson Proof (2015) | 2,653 | 2,653 | – | – |
| Lady Bird Johnson Uncirculated (2015) | 1,830 | 1,833 | 3 | 0.16% |
| Jacqueline Kennedy Proof (2015)* | 11,222 | 11,222 | – | – |
| Jacqueline Kennedy Uncirculated (2015) | 6,769 | 6,771 | 2 | 0.03% |
| Mamie Eisenhower Proof (2015)* | 2,704 | 2,704 | – | – |
| Mamie Eisenhower Uncirculated (2015) | 2,041 | 2,044 | 3 | 0.15% |
| Bess Truman Proof (2015) | 2,702 | 2,708 | 6 | 0.22% |
| Bess Truman Uncirculated (2015) | 1,897 | 1,898 | 1 | 0.05% |
| Eleanor Roosevelt Proof (2014)* | 2,377 | 2,377 | – | – |
| Eleanor Roosevelt Uncirculated (2014)* | 1,886 | 1,886 | – | – |
| Lou Hoover Proof (2014)* | 2,392 | 2,392 | – | – |
| Lou Hoover Uncirculated (2014)* | 1,936 | 1,936 | – | – |
| Grace Coolidge Proof (2014)* | 2,315 | 2,315 | – | – |
| Grace Coolidge Uncirculated (2014)* | 1,949 | 1,949 | – | – |
| Florence Harding Proof (2014)* | 2,372 | 2,372 | – | – |
| Florence Harding Uncirculated (2014)* | 1,944 | 1,944 | – | – |
| Edith Wilson Proof (2013)* | 2,464 | 2,464 | – | – |
| Edith Wilson Uncirculated (2013)* | 1,974 | 1,974 | – | – |
| Ellen Wilson Proof (2013)* | 2,511 | 2,511 | – | – |
| Ellen Wilson Uncirculated (2013)* | 1,980 | 1,980 | – | – |
| Helen Taft Proof (2013)* | 2,598 | 2,598 | – | – |
| Helen Taft Uncirculated (2013)* | 1,993 | 1,993 | – | – |
| Edith Roosevelt Proof (2013)* | 2,840 | 2,840 | – | – |
| Edith Roosevelt Uncirculated (2013)* | 2,027 | 2,027 | – | – |
| Ida McKinley Proof (2013)* | 2,724 | 2,724 | – | – |
| Ida McKinley Uncirculated (2013)* | 2,008 | 2,008 | – | – |
| Alice Paul Proof (2012)* | 3,505 | 3,505 | – | – |
| Alice Paul Uncirculated (2012)* | 2,798 | 2,798 | – | – |
| Frances Cleveland Proof (2012, 1st Term)* | 3,158 | 3,158 | – | – |
| Frances Cleveland Uncirculated (2012 1st Term)* | 2,454 | 2,454 | – | – |
| Caroline Harrison Proof (2012)* | 3,046 | 3,046 | – | – |
| Caroline Harrison Uncirculated (2012)* | 2,436 | 2,436 | – | – |
| Frances Cleveland Proof (2012, 2nd Term)* | 3,104 | 3,104 | – | – |
| Frances Cleveland Uncirculated (2012 2nd Term)* | 2,425 | 2,425 | – | – |
Presidential $1 Coin Sets |
||||
| Old Sales |
Latest Sales |
Gain/ Loss |
% Increase |
|
| 2016-P* | 9,717 | 9,717 | – | – |
| 2016-D* | 7,026 | 7,026 | – | – |
| 2015-P | 13,429 | 13,450 | 21 | 0.16% |
| 2015-D | 10,981 | 10,997 | 16 | 0.15% |
| 2014-P | 13,971 | 13,983 | 12 | 0.09% |
| 2014-D | 10,455 | 10,463 | 8 | 0.08% |
| 2013-P* | 17,771 | 17,771 | – | – |
| 2013-D* | 14,923 | 14,923 | – | – |
Presidential Coins & First Spouse Medal Sets |
||||
| Old Sales |
Latest Sales |
Gain/ Loss |
% Increase |
|
| Reagan | 14,343 | 14,380 | 37 | 0.26% |
| Ford | 6,740 | 6,752 | 12 | 0.18% |
| Nixon | 7,861 | 7,877 | 16 | 0.20% |
| Johnson | 8,235 | 8,247 | 12 | 0.15% |
| Kennedy* | 24,183 | 24,183 | – | – |
| Eisenhower | 9,847 | 9,847 | – | – |
| Truman | 8,491 | 8,494 | 3 | 0.04% |
| Roosevelt* | 7,000 | 7,000 | – | – |
| Hoover* | 4,500 | 4,500 | – | – |
| Coolidge* | 4,500 | 4,500 | – | – |
| Harding* | 4,500 | 4,500 | – | – |
| Edith Wilson | 3,979 | 3,979 | – | – |
| Ellen Wilson | 3,998 | 3,998 | – | – |
| Helen Taft | 3,994 | 3,994 | – | – |
| Edith Roosevelt | 5,002 | 5,002 | – | – |
| Ida McKinley | 3,994 | 3,994 | – | – |
| Abigail Fillmore | 11,246 | 11,248 | 2 | 0.02% |
| Jane Pierce | 9,013 | 9,014 | 1 | 0.01% |
| Buchanan’s Liberty | 9,065 | 9,066 | 1 | 0.01% |
| Mary Todd Lincoln* | 15,858 | 15,858 | – | – |
| Eliza Johnson | 7,359 | 7,360 | 1 | 0.01% |
| Julia Grant* | 7,983 | 7,983 | – | – |
| Lucy Hayes | 6,381 | 6,382 | 1 | 0.02% |
| Lucretia Garfield | 6,181 | 6,182 | 1 | 0.02% |
| Alice Paul | 6,197 | 6,198 | 1 | 0.02% |
| Frances Cleveland (1st) | 5,663 | 5,664 | 1 | 0.02% |
| Caroline Harrison | 5,550 | 5,551 | 1 | 0.02% |
| Frances Cleveland (2nd) | 5,399 | 5,399 | – | – |
Presidential $1 Coin Covers |
||||
| Old Sales |
Latest Sales |
Gain/ Loss |
% Increase |
|
| Ronald Reagan | 18,867 | 18,900 | 33 | 0.17% |
| Gerald R. Ford | 12,418 | 12,432 | 14 | 0.11% |
| Richard M. Nixon | 14,084 | 14,095 | 11 | 0.08% |
| Lyndon B. Johnson | 13,409 | 13,422 | 13 | 0.10% |
| John F. Kennedy | 23,370 | 23,398 | 28 | 0.12% |
| Dwight D. Eisenhower* | 14,823 | 14,823 | – | – |
| Harry S. Truman | 14,788 | 14,788 | – | – |
| Franklin Roosevelt | 15,057 | 15,067 | 10 | 0.07% |
| Herbert Hoover | 12,483 | 12,486 | 3 | 0.02% |
| Calvin Coolidge | 12,982 | 12,984 | 2 | 0.02% |
| Warren G. Harding | 13,139 | 13,141 | 2 | 0.02% |
| William Henry Harrison | 30,837 | 30,837 | – | – |
| John Tyler | 27,470 | 27,470 | – | – |
| James K. Polk | 25,703 | 25,703 | – | – |
| Zachary Taylor | 24,669 | 24,669 | – | – |
| Millard Fillmore | 23,896 | 23,896 | – | – |
| Franklin Pierce | 22,341 | 22,341 | – | – |
| James Buchanan | 21,075 | 21,075 | – | – |
| Abraham Lincoln* | 36,783 | 36,783 | – | – |
| Andrew Johnson | 19,544 | 19,544 | – | – |
| Ulysses S. Grant | 20,351 | 20,353 | 2 | 0.01% |
| Rutherford B. Hayes | 17,759 | 17,759 | – | – |
| James Garfield | 16,866 | 16,866 | – | – |
| Chester Arthur | 17,130 | 17,130 | – | – |
| Grover Cleveland (1st) | 15,508 | 15,509 | 1 | 0.01% |
| Benjamin Harrison | 15,224 | 15,224 | – | – |
| Grover Cleveland (2nd) | 14,509 | 14,509 | – | – |
| William McKinley | 14,883 | 14,884 | 1 | 0.01% |
| Theodore Roosevelt | 17,544 | 17,550 | 6 | 0.03% |
| William Howard Taft | 13,777 | 13,781 | 4 | 0.03% |
| Woodrow Wilson | 13,423 | 13,425 | 2 | 0.01% |
2016 Ronald Reagan $1 Coin Rolls, Bags, Boxes |
||||
| Old Sales |
Latest Sales |
Gain/ Loss |
% Increase |
|
| 25-coin roll set (P) | 46,109 | 46,155 | 46 | 0.10% |
| 25-coin roll set (D) | 41,616 | 41,646 | 30 | 0.07% |
| 100-coin bag (P) | 2,242 | 2,248 | 6 | 0.27% |
| 100-coin bag (D) | 2,073 | 2,077 | 4 | 0.19% |
| 250-coin box (P) | 7,393 | 7,398 | 5 | 0.07% |
| 250-coin box (D) | 6,675 | 6,678 | 3 | 0.04% |
2016 Gerald R. Ford $1 Coin Rolls, Bags, Boxes |
||||
| Old Sales |
Latest Sales |
Gain/ Loss |
% Increase |
|
| 25-coin roll set (P) | 43,791 | 43,816 | 25 | 0.06% |
| 25-coin roll set (D) | 39,245 | 39,261 | 16 | 0.04% |
| 100-coin bag (P) | 2,637 | 2,640 | 3 | 0.11% |
| 100-coin bag (D) | 1,149 | 1,151 | 2 | 0.17% |
| 250-coin box (P) | 4,809 | 4,808 | -1 | -0.02% |
| 250-coin box (D) | 4,700 | 4,702 | 2 | 0.04% |
2016 Richard M. Nixon $1 Coin Rolls, Bags, Boxes |
||||
| Old Sales |
Latest Sales |
Gain/ Loss |
% Increase |
|
| 25-coin roll set (P) | 45,581 | 45,604 | 23 | 0.05% |
| 25-coin roll set (D) | 39,702 | 39,715 | 13 | 0.03% |
| 100-coin bag (P) | 2,771 | 2,773 | 2 | 0.07% |
| 100-coin bag (D) | 1,329 | 1,330 | 1 | 0.08% |
| 250-coin box (P) | 5,150 | 5,157 | 7 | 0.14% |
| 250-coin box (D) | 5,065 | 5,073 | 8 | 0.16% |
2015 Lyndon B. Johnson $1 Coin Rolls, Bags, Boxes |
||||
| Old Sales |
Latest Sales |
Gain/ Loss |
% Increase |
|
| 25-coin roll set (P)* | 40,000 | 40,000 | – | – |
| 25-coin roll set (D)* | 37,742 | 37,742 | – | – |
| 100-coin bag (P) | 1,833 | 1,836 | 3 | 0.16% |
| 100-coin bag (D) | 1,646 | 1,646 | – | – |
| 250-coin box (P) | 4,688 | 4,688 | – | – |
| 250-coin box (D) | 6,228 | 6,227 | -1 | -0.02% |
2015 John F. Kennedy $1 Coin Rolls, Bags, Boxes |
||||
| Old Sales |
Latest Sales |
Gain/ Loss |
% Increase |
|
| 25-coin roll set (P) | 53,136 | 53,159 | 23 | 0.04% |
| 25-coin roll set (D) | 47,590 | 47,603 | 13 | 0.03% |
| 100-coin bag (P) | 2,770 | 2,775 | 5 | 0.18% |
| 100-coin bag (D) | 2,541 | 2,542 | 1 | 0.04% |
| 250-coin box (P) | 7,857 | 7,857 | – | – |
| 250-coin box (D) | 7,260 | 7,267 | 7 | 0.10% |
2015 Dwight D. Eisenhower $1 Coin Rolls, Bags, Boxes |
||||
| Old Sales |
Latest Sales |
Gain/ Loss |
% Increase |
|
| 25-coin roll set (P)* | 39,729 | 39,729 | – | – |
| 25-coin roll set (D)* | 37,728 | 37,728 | – | – |
| 100-coin bag (P) | 2,548 | 2,552 | 4 | 0.16% |
| 100-coin bag (D) | 2,410 | 2,411 | 1 | 0.04% |
| 250-coin box (P) | 7,895 | 7,894 | -1 | -0.01% |
| 250-coin box (D) | 6,229 | 6,234 | 5 | 0.08% |
2015 Harry S. Truman $1 Coin Rolls, Bags, Boxes |
||||
| Old Sales |
Latest Sales |
Gain/ Loss |
% Increase |
|
| 25-coin roll set (P)* | 39,686 | 39,686 | – | – |
| 25-coin roll set (D)* | 37,655 | 37,655 | – | – |
| 100-coin bag (P)* | 3,492 | 3,492 | – | – |
| 100-coin bag (D)* | 3,334 | 3,334 | – | – |
| 250-coin box (P) | 8,237 | 8,242 | 5 | 0.06% |
| 250-coin box (D) | 6,455 | 6,462 | 7 | 0.11% |
2014 Franklin Roosevelt $1 Coin Rolls, Bags, Boxes |
||||
| Old Sales |
Latest Sales |
Gain/ Loss |
% Increase |
|
| 25-coin roll set (P) | 59,213 | 59,232 | 19 | 0.03% |
| 25-coin roll set (D) | 53,684 | 53,697 | 13 | 0.02% |
| 100-coin bag (P)* | 1,986 | 1,986 | – | – |
| 100-coin bag (D)* | 1,968 | 1,968 | – | – |
| 250-coin box (P)* | 6,977 | 6,977 | – | – |
| 250-coin box (D)* | 5,025 | 5,025 | – | – |
2014 Herbert Hoover $1 Coin Rolls, Bags, Boxes |
||||
| Old Sales |
Latest Sales |
Gain/ Loss |
% Increase |
|
| 25-coin roll set (P) | 53,282 | 53,300 | 18 | 0.03% |
| 25-coin roll set (D) | 46,448 | 46,460 | 12 | 0.03% |
| 100-coin bag (P)* | 1,978 | 1,978 | – | – |
| 100-coin bag (D)* | 1,990 | 1,990 | – | – |
| 250-coin box (P) | 6,994 | 6,994 | – | – |
| 250-coin box (D)* | 5,050 | 5,050 | – | – |
Native American Dollar Rolls |
||||
| Old Sales |
Latest Sales |
Gain/ Loss |
% Increase |
|
| 2017-dated 25-coin roll set (P) | 13,396 | 13,495 | 99 | 0.74% |
| 2017-dated 25-coin roll set (D) | 13,078 | 13,158 | 80 | 0.61% |
| 2017-dated 100-coin bag (P) | 944 | 956 | 12 | 1.27% |
| 2017-dated 100-coin bag (D) | 905 | 918 | 13 | 1.44% |
| 2017-dated 250-coin box (P) | 1,249 | 1,258 | 9 | 0.72% |
| 2017-dated 250-coin box (D) | 1,523 | 1,527 | 4 | 0.26% |
| 2016-dated 25-coin roll set (P) | 17,440 | 17,455 | 15 | 0.09% |
| 2016-dated 25-coin roll set (D) | 17,019 | 17,037 | 18 | 0.11% |
| 2016-dated 100-coin bag (P) | 2,135 | 2,139 | 4 | 0.19% |
| 2016-dated 100-coin bag (D) | 2,051 | 2,054 | 3 | 0.15% |
| 2016-dated 250-coin box (P) | 1,855 | 1,858 | 3 | 0.16% |
| 2016-dated 250-coin box (D) | 2,013 | 2,018 | 5 | 0.25% |
| 2015-dated 25-coin roll set (P)* | 18,763 | 18,763 | – | – |
| 2015-dated 25-coin roll set (D)* | 19,021 | 19,021 | – | – |
| 2015-dated 100-coin bag (P)* | 2,415 | 2,415 | – | – |
| 2015-dated 100-coin bag (D)* | 2,455 | 2,455 | – | – |
| 2015-dated 250-coin box (P)* | 2,329 | 2,329 | – | – |
| 2015-dated 250-coin box (D)* | 2,311 | 2,311 | – | – |
Kennedy Half Dollar Rolls |
||||
| Old Sales |
Latest Sales |
Gain/ Loss |
% Increase |
|
| 2017-dated 200-coin bag (P&D) | 6,535 | 6,700 | 165 | 2.52% |
| 2017-dated 2-roll set (P&D) | 18,124 | 18,362 | 238 | 1.31% |
| 2016-dated 200-coin bag (P&D) | 10,963 | 10,965 | 2 | 0.02% |
| 2016-dated 2-roll set (P&D) | 22,658 | 22,675 | 17 | 0.08% |
| 2015-dated 200-coin bag (P&D)* | 13,762 | 13,762 | – | – |
| 2015-dated 2-roll set (P&D) | 28,487 | 28,487 | – | – |
America the Beautiful Quarters Uncirculated Coin Set |
||||
| Old Sales |
Latest Sales |
Gain/ Loss |
% Increase |
|
| 2017 Issue | 23,178 | 23,526 | 348 | 1.50% |
| 2016 Issue* | 29,559 | 29,559 | – | – |
| 2015 Issue | 28,779 | 28,798 | 19 | 0.07% |
| 2014 Issue | 30,560 | 30,598 | 38 | 0.12% |
| 2013 Issue | 43,060 | 43,097 | 37 | 0.09% |
| 2012 Issue* | 42,223 | 42,223 | – | – |
| 2011 Issue | 40,621 | 40,631 | 10 | 0.02% |
| 2010 Issue | 41,985 | 41,995 | 10 | 0.02% |
America the Beautiful Quarters Circulating Coin Set |
||||
| Old Sales |
Latest Sales |
Gain/ Loss |
% Increase |
|
| 2016 Issue | 19,871 | 19,927 | 56 | 0.28% |
| 2015 Issue | 22,116 | 22,130 | 14 | 0.06% |
| 2014 Issue | 24,569 | 24,581 | 12 | 0.05% |
| 2013 Issue | 29,840 | 29,851 | 11 | 0.04% |
| 2012 Issue* | 24,869 | 24,869 | – | – |
| 2011 Issue | 37,057 | 37,070 | 13 | 0.04% |
| 2010 Issue | 40,620 | 40,634 | 14 | 0.03% |
America the Beautiful Quarters Three-Coin Sets |
||||
| Old Sales |
Latest Sales |
Gain/ Loss |
% Increase |
|
| Ellis Island | – | 10,513 | – | – |
| Ozark Riverways | 11,553 | 11,772 | 219 | 1.90% |
| Frederick Douglass | 12,279 | 12,403 | 124 | 1.01% |
| Effigy Mounds | 12,188 | 12,257 | 69 | 0.57% |
| Fort Moultrie | 12,322 | 12,333 | 11 | 0.09% |
| Theodore Roosevelt | 14,925 | 14,938 | 13 | 0.09% |
| Harpers Ferry | 13,420 | 13,430 | 10 | 0.07% |
| Cumberland Gap | 14,187 | 14,194 | 7 | 0.05% |
| Shawnee | 14,694 | 14,701 | 7 | 0.05% |
| Saratoga | 14,895 | 14,899 | 4 | 0.03% |
| Bombay Hook | 13,349 | 13,353 | 4 | 0.03% |
| Blue Ridge Parkway | 17,106 | 17,110 | 4 | 0.02% |
| Kisatchie Set | 15,146 | 15,158 | 12 | 0.08% |
| Homestead Set | 16,068 | 16,070 | 2 | 0.01% |
| Everglades Set | 14,318 | 14,323 | 5 | 0.03% |
| Great Sand Dunes Set | 14,075 | 14,078 | 3 | 0.02% |
| Arches Three-Coin Set | 15,784 | 15,789 | 5 | 0.03% |
| Shenandoah Three-Coin Set | 17,300 | 17,305 | 5 | 0.03% |
| Great Smoky Mountains Set | 18,588 | 18,588 | – | – |
| Mount Rushmore Quarters Set | 17,830 | 17,839 | 9 | 0.05% |
| Fort McHenry Quarters Set | 16,282 | 16,287 | 5 | 0.03% |
| Great Basin Quarters Set | 15,480 | 15,482 | 2 | 0.01% |
| Perry’s Victory Quarters Set | 17,594 | 17,597 | 3 | 0.02% |
| White Mountain Quarters Set | 18,056 | 18,056 | – | – |
| Denali Quarters Set | 18,068 | 18,076 | 8 | 0.04% |
| Hawaii Volcanoes Quarters Set* | 16,508 | 16,647 | – | – |
| Acadia Quarters Set | 19,940 | 19,940 | – | – |
| Chaco Culture Quarters Set | 19,908 | 19,914 | 6 | 0.03% |
| El Yunque Quarters Set* | 19,891 | 19,891 | – | – |
| Chickasaw Quarters Set | 16,137 | 16,138 | 1 | 0.01% |
| Vicksburg Quarters Set | 18,040 | 18,049 | 9 | 0.05% |
| Olympic Quarters Set | 17,670 | 17,673 | 3 | 0.02% |
| Glacier Quarters Set | 18,984 | 18,987 | 3 | 0.02% |
| Gettysburg Quarters Set | 22,755 | 22,759 | 4 | 0.02% |
| Mount Hood Quarters Set | 18,335 | 18,339 | 4 | 0.02% |
| Grand Canyon Quarters Set | 22,062 | 22,068 | 6 | 0.03% |
| Yosemite Quarters Set | 22,079 | 22,084 | 5 | 0.02% |
| Yellowstone Quarters Set | 24,959 | 24,963 | 4 | 0.02% |
| Hot Springs Quarters Set | 23,150 | 23,156 | 6 | 0.03% |
2017 Ellis Island Quarters |
||||
| Old Sales |
Latest Sales |
Gain/ Loss |
% Increase |
|
| 100-Coin Bag (S) | 3,174 | 3,322 | 148 | 4.66% |
| 40-Coin Roll (S) | 2,592 | 2,741 | 149 | 5.75% |
| Three-Roll Set | 6,589 | 6,967 | 378 | 5.74% |
| 100-Coin Bag (P) | 1,841 | 1,929 | 88 | 4.78% |
| 100-Coin Bag (D) | 1,723 | 1,813 | 90 | 5.22% |
| Two-Roll Set | 5,913 | 6,014 | 101 | 1.71% |
2017 Ozark Riverways Quarters |
||||
| Old Sales |
Latest Sales |
Gain/ Loss |
% Increase |
|
| 100-Coin Bag (S) | 3,574 | 3,622 | 48 | 1.34% |
| 40-Coin Roll (S) | 3,293 | 3,326 | 33 | 1.00% |
| Three-Roll Set | 7,595 | 7,663 | 68 | 0.90% |
| 100-Coin Bag (P) | 1,925 | 1,940 | 15 | 0.78% |
| 100-Coin Bag (D) | 1,889 | 1,907 | 18 | 0.95% |
| Two-Roll Set | 6,274 | 6,292 | 18 | 0.29% |
2017 Frederick Douglass Quarters |
||||
| Old Sales |
Latest Sales |
Gain/ Loss |
% Increase |
|
| 100-Coin Bag (S) | 3,822 | 3,876 | 54 | 1.41% |
| 40-Coin Roll (S) | 3,448 | 3,471 | 23 | 0.67% |
| Three-Roll Set | 8,077 | 8,130 | 53 | 0.66% |
| 100-Coin Bag (P) | 2,112 | 2,117 | 5 | 0.24% |
| 100-Coin Bag (D) | 2,030 | 2,038 | 8 | 0.39% |
| Two-Roll Set | 6,556 | 6,562 | 6 | 0.09% |
2017 Effigy Mounds Quarters |
||||
| Old Sales |
Latest Sales |
Gain/ Loss |
% Increase |
|
| 100-Coin Bag (S) | 3,867 | 3,926 | 59 | 1.53% |
| 40-Coin Roll (S) | 3,614 | 3,631 | 17 | 0.47% |
| Three-Roll Set | 8,249 | 8,281 | 32 | 0.39% |
| 100-Coin Bag (P) | 2,202 | 2,204 | 2 | 0.09% |
| 100-Coin Bag (D) | 2,080 | 2,083 | 3 | 0.14% |
| Two-Roll Set | 6,708 | 6,711 | 3 | 0.04% |
2016 Fort Moultrie Quarters |
||||
| Old Sales |
Latest Sales |
Gain/ Loss |
% Increase |
|
| 100-Coin Bag (S) | 4,346 | 4,350 | 4 | 0.09% |
| 40-Coin Roll (S) | 4,090 | 4,098 | 8 | 0.20% |
| Three-Roll Set | 8,788 | 8,801 | 13 | 0.15% |
| 100-Coin Bag (P) | 2,233 | 2,236 | 3 | 0.13% |
| 100-Coin Bag (D) | 2,162 | 2,167 | 5 | 0.23% |
| Two-Roll Set | 6,986 | 6,988 | 2 | 0.03% |
2016 Theodore Roosevelt Quarters |
||||
| Old Sales |
Latest Sales |
Gain/ Loss |
% Increase |
|
| 100-Coin Bag (S) | 4,777 | 4,780 | 3 | 0.06% |
| 40-Coin Roll (S) | 4,572 | 4,578 | 6 | 0.13% |
| Three-Roll Set | 9,524 | 9,531 | 7 | 0.07% |
| 100-Coin Bag (P) | 2,385 | 2,391 | 6 | 0.25% |
| 100-Coin Bag (D) | 2,230 | 2,234 | 4 | 0.18% |
| Two-Roll Set | 7,527 | 7,533 | 6 | 0.08% |
2016 Harpers Ferry Quarters |
||||
| Old Sales |
Latest Sales |
Gain/ Loss |
% Increase |
|
| 100-Coin Bag (S) | 4,686 | 4,687 | 1 | 0.02% |
| 40-Coin Roll (S) | 4,440 | 4,446 | 6 | 0.14% |
| Three-Roll Set | 9,413 | 9,419 | 6 | 0.06% |
| 100-Coin Bag (P) | 2,214 | 2,214 | – | – |
| 100-Coin Bag (D) | 2,136 | 2,138 | 2 | 0.09% |
| Two-Roll Set | 7,676 | 7,676 | – | – |
2016 Cumberland Gap Quarters |
||||
| Old Sales |
Latest Sales |
Gain/ Loss |
% Increase |
|
| 100-Coin Bag (S) | 4,580 | 4,581 | 1 | 0.02% |
| 40-Coin Roll (S) | 4,428 | 4,432 | 4 | 0.09% |
| Three-Roll Set | 9,409 | 9,412 | 3 | 0.03% |
| 100-Coin Bag (P) | 2,314 | 2,316 | 2 | 0.09% |
| 100-Coin Bag (D) | 2,258 | 2,258 | – | – |
| Two-Roll Set | 7,481 | 7,481 | – | – |
2016 Shawnee Quarters |
||||
| Old Sales |
Latest Sales |
Gain/ Loss |
% Increase |
|
| 100-Coin Bag (S) | 4,861 | 4,862 | 1 | 0.02% |
| 40-Coin Roll (S) | 4,542 | 4,547 | 5 | 0.11% |
| Three-Roll Set | 9,798 | 9,802 | 4 | 0.04% |
| 100-Coin Bag (P) | 2,270 | 2,272 | 2 | 0.09% |
| 100-Coin Bag (D) | 2,223 | 2,225 | 2 | 0.09% |
| Two-Roll Set | 7,661 | 7,661 | – | – |
Visit the United States Mint website at http://catalog.usmint.gov for product information.