
Precious metals futures declined Wednesday, Aug. 30, with gold dropping from an 11-month high and silver falling for a second day in a row.
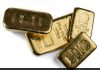
Gold for December delivery shed $4.80, or 0.4%, to settle at $1,314.10 an ounce on the Comex division of the New York Mercantile Exchange.
Gold has "decidedly broke out to the upside through resistance at $1,300 and [closed] comfortably above that level two days in a row," MarketWatch quoted Tyler Richey, co-editor of the Sevens Report.
"The near-term trend is now higher, but the gold market has been finicky over the last two months, as now both a significant support and significant resistance level has been violated," he said. "That leaves the broader technical outlook very cloudy."
Gold futures ranged from a low of $1,310.10 to a high of $1,319.30. They advanced 0.3% in the previous session, scoring their highest settlement since Sept. 29, and gained 1.3% in their start to the week on Monday.
Silver for December delivery — the new, most active contract — declined 1.3 cents, or less than 0.1%, to settle at $17.503 an ounce — the highest close for a most active contract since June 6.
Silver futures traded between $17.37 and $17.56. They also dipped less than 0.1% on Tuesday, but rallied 2.3% on Monday.
In PGM futures on Wednesday:
-
October platinum lost $8.30, or 0.8%, to $995.20 an ounce, ranging from $986.10 to $1,003.40.
- Palladium for December delivery dropped $12.65, or 1.3%, to $931.05 an ounce, trading between $926.75 and $944.35. They ended at $943.70 an ounce on Tuesday, logging their best close since February 2001.
London Precious Metals Prices
In comparing earlier fixed London gold and silver prices from Tuesday PM to Wednesday PM:
- Gold declined $10.15 or 0.8%, to 1,308.50 an ounce.
- Silver fell 16 cents, or 0.9%, to $17.44 an ounce.
LBMA platinum and palladium prices are available on the LBMA’s website with a delay of midnight.
US Mint Bullion Sales in 2017
U.S. Mint bullion sales were unchanged Wednesday. Below is a sales breakdown of U.S. bullion products with columns listing the number of coins sold during varying periods. Products with an asterisk (*) are no longer available.
| US Mint Bullion Sales (# of coins) | ||||||
|---|---|---|---|---|---|---|
| Wednesday | Last Week | This Week | July | August | YTD | |
| $100 American Eagle 1 Oz Platinum Coin | 0 | 0 | 0 | 0 | 0 | 20,000 |
| $50 American Eagle 1 Oz Gold Coin | 0 | 1,500 | 500 | 13,500 | 6,500 | 162,000 |
| $25 American Eagle 1/2 Oz Gold Coin | 0 | 1,000 | 0 | 0 | 2,000 | 29,000 |
| $10 American Eagle 1/4 Oz Gold Coin | 0 | 2,000 | 0 | 4,000 | 2,000 | 54,000 |
| $5 American Eagle 1/10 Oz Gold Coin | 0 | 15,000 | 0 | 30,000 | 15,000 | 305,000 |
| $50 American Buffalo 1 Oz Gold Coin | 0 | 500 | 500 | 6,000 | 3,000 | 75,000 |
| $1 American Eagle 1 Oz Silver Coin | 0 | 190,000 | 600,000 | 2,320,000 | 1,025,000 | 15,578,500 |
| 2017 Effigy Mounds 5 Oz Silver Coin | 0 | 0 | 0 | 0 | 0 | 35,000 |
| 2017 Frederick Douglass 5 Oz Silver Coin | 0 | 0 | 0 | 0 | 0 | 20,000 |
| 2017 Ozark Riverways 5 Oz Silver Coin | 0 | 0 | 0 | 0 | 0 | 20,000 |
| 2017 Ellis Island 5 Oz Silver Coin | 0 | N/A | 39,500 | N/A | 39,500 | 39,500 |