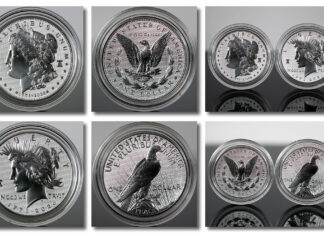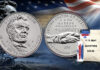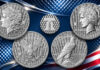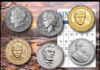
Two commemorative United States Mint products launched last week, the 2017 Lions Clubs International Centennial Silver Dollars in proof and uncirculated qualities.

But having already talked about them aplenty for now (read about their first-day sales or look at Lions Clubs dollar photos), we’ll jump straight to the topic that headlines this article.
Mintage Low: 2016-W Uncirculated NPS Gold Commemorative Coin
Four weeks ago, the U.S. Mint stopped selling all 2016-dated commemorative coins. And with that, the 2016-D Uncirculated National Park Service 50c Commemorative Coin and the 2016-W Proof Mark Twain $5 Gold Commemorative Coin each marked mintage lows for their type.
Since then, the 2016-W Uncirculated National Park Service $5 Gold Commemorative Coin joined the club. With three straight weeks of downward adjustments, its latest sales total is now 5,164 coins. That’s the lowest for a modern commemorative, displacing the 1997-W Uncirculated Jackie Robinson Gold Coin with its mintage of 5,174. The Jackie Robinson coin has enjoyed strong secondary market prices during its reign atop the list of "most scarce" commemorative coins.
Weekly U.S. Mint Top Sellers
Here’s a showing of the Mint’s most popular products for the week ended Jan. 22:
- 2017 Proof Lion Clubs Silver Dollars (+23,349)
- 2017 Uncirculated Lion Clubs Silver Dollars (+7,107)
- 2017 America the Beautiful Quarters Proof Set (+2,289 to 39,966)
- 2016-W Proof Silver Eagle (+1,366 to 530,887)
- 2016 Proof Set (+1,333 to 580,009)
- 2016 Silver Proof Set (+1,088 to 360,610)
- 2016 Mint Set (+996 to 269,491)
- 2017 Happy Birthday Coin Set (+895 to 3,314)
- 2017 Birth Set (+823 to 3,589)
- 2016 $50 Proof Gold Eagle (+591 to 22,902)
The U.S. Mint published sales data for 247 numismatic products. Ninety-six of them outperformed their prior weekly gains compared to 106 previously. Four of them increased by more than 1,000 units compared to 7 previously.
Sixteen products also saw their sales total reduced compared to 18 previously. As typical, most of them logged modest declines. The two products to fall furthest include the 2016-W Uncirculated Silver Eagle, down 418 to 167,753; and the 2016 Silver Proof Set, down 93 to 387,321.
US Mint Sales: Numismatic Products
Below are tables showing the latest sales for U.S. Mint numismatic products. The sales period covers Jan. 16 to 22. Products with an asterisk (*) are no longer available.
2016 Centennial Gold Coins |
||||
| Old Sales |
Latest Sales |
Gain/ Loss |
% Increase |
|
| Gold Walking Liberty Half-Dollar | 60,411 | 60,810 | 399 | 0.66% |
| Gold Standing Liberty Quarter | 87,171 | 87,443 | 272 | 0.31% |
| Gold Mercury Dime* | 124,891 | 124,884 | -7 | -0.01% |
2016 American Liberty Silver Medals |
||||
| Old Sales |
Latest Sales |
Gain/ Loss |
% Increase |
|
| San Francisco Mint* | 12,176 | 12,176 | – | – |
| West Point Mint* | 12,183 | 12,183 | – | – |
2016 NPS Commemorative Coins |
||||
| Old Sales |
Latest Sales |
Gain/ Loss |
% Increase |
|
| $5 Gold Proof | 4,915 | 4,917 | 2 | 0.04% |
| $5 Gold Uncirculated | 5,180 | 5,164 | -16 | -0.31% |
| $1 Silver Proof | 62,726 | 62,726 | – | – |
| $1 Silver Uncirculated | 20,997 | 20,997 | – | – |
| 50c Proof Clad Half-Dollar | 40,261 | 40,256 | -5 | -0.01% |
| 50c Uncirculated Clad Half-Dollar | 21,030 | 21,016 | -14 | -0.07% |
| Three-Coin Proof Set | 14,591 | 14,589 | -2 | -0.01% |
2016 Mark Twain Commemorative Coins |
||||
| Old Sales |
Latest Sales |
Gain/ Loss |
% Increase |
|
| $5 Gold Proof | 13,269 | 13,266 | -3 | -0.02% |
| $5 Gold Uncirculated | 5,697 | 5,693 | -4 | -0.07% |
| $1 Silver Proof | 78,540 | 78,536 | -4 | -0.01% |
| $1 Silver Uncirculated | 26,285 | 26,284 | -1 | 0.00% |
Clad Proof Sets |
||||
| Old Sales |
Latest Sales |
Gain/ Loss |
% Increase |
|
| 2016 Proof Set | 578,676 | 580,009 | 1,333 | 0.23% |
| 2015 Proof Sets* | 662,900 | 662,876 | -24 | 0.00% |
| 2014 Proof Sets* | 714,661 | 714,661 | – | – |
| 2013 Proof Sets* | 802,460 | 802,460 | – | – |
| 2016 America the Beautiful Quarters Proof Sets | 37,677 | 39,966 | 2,289 | 6.08% |
| 2016 America the Beautiful Quarters Proof Sets | 85,659 | 85,873 | 214 | 0.25% |
| 2015 America the Beautiful Quarters Proof Sets | 99,507 | 99,477 | -30 | -0.03% |
| 2014 America the Beautiful Quarters Proof Sets* | 115,179 | 115,179 | – | – |
| 2013 America the Beautiful Quarters Proof Sets* | 128,377 | 128,377 | – | – |
| 2016 Ronald Reagan Coin & Chronicles Set | 40,344 | 40,511 | 167 | 0.41% |
| 2015 Lyndon B. Johnson Coin & Chronicles Set* | 23,905 | 23,905 | – | – |
| 2015 John F. Kennedy Coin & Chronicles Set* | 49,051 | 49,051 | – | – |
| 2015 Eisenhower Coin & Chronicles Set* | 16,744 | 16,744 | – | – |
| 2015 Truman Coin & Chronicles Set* | 16,812 | 16,812 | – | – |
| 2014 Franklin D. Roosevelt Coin & Chronicles Set* | 19,050 | 19,050 | – | – |
| 2013 Theodore Roosevelt Coin & Chronicles Set* | 15,145 | 15,145 | – | – |
| 2016 Presidential $1 Coin Proof Sets | 213,770 | 214,063 | 293 | 0.14% |
| 2015 Presidential $1 Coin Proof Sets* | 222,068 | 222,068 | – | – |
| 2014 Presidential $1 Coin Proof Sets* | 229,415 | 229,415 | – | – |
| 2013 Presidential $1 Coin Proof Sets* | 266,618 | 266,618 | – | – |
| 2017 Happy Birthday Gift Sets | 2,419 | 3,314 | 895 | 37.00% |
| 2016 Happy Birthday Gift Sets | 15,996 | 16,066 | 70 | 0.44% |
| 2015 Happy Birthday Gift Sets* | 14,470 | 14,470 | – | – |
| 2014 Happy Birthday Gift Sets | 13,196 | 13,199 | 3 | 0.02% |
| 2013 Happy Birthday Gift Sets | 11,743 | 11,748 | 5 | 0.04% |
| 2017 Birth Gift Sets | 2,766 | 3,589 | 823 | 29.75% |
| 2016 Birth Gift Sets | 29,707 | 29,707 | – | – |
| 2015 Birth Gift Sets* | 34,548 | 34,548 | – | – |
| 2014 Birth Gift Sets | 35,010 | 35,030 | 20 | 0.06% |
| 2013 Birth Gift Sets | 41,835 | 41,851 | 16 | 0.04% |
| 2012 Birth Gift Sets* | 49,703 | 49,703 | – | – |
Silver Proof Sets |
||||
| Old Sales |
Latest Sales |
Gain/ Loss |
% Increase |
|
| 2016 Silver Proof Sets | 359,522 | 360,610 | 1,088 | 0.30% |
| 2015 Silver Proof Sets* | 387,414 | 387,321 | -93 | -0.02% |
| 2014 Silver Proof Sets* | 429,493 | 429,493 | – | – |
| 2016 America the Beautiful Quarters Silver Proof Sets | 89,143 | 89,334 | 191 | 0.21% |
| 2015 America the Beautiful Quarters Silver Proof Sets | 103,367 | 103,367 | – | – |
| 2014 America the Beautiful Quarters Silver Proof Sets* | 119,251 | 119,251 | – | – |
| 2013 America the Beautiful Quarters Silver Proof Sets* | 138,451 | 138,451 | – | – |
| 2016 Congratulations Gift Sets | 2,172 | 2,209 | 37 | 1.70% |
| 2015 Congratulations Gift Sets* | 7,895 | 7,895 | – | – |
| 2014 Congratulations Gift Sets* | 7,529 | 7,529 | – | – |
| 2013 Congratulations Gift Sets* | 18,347 | 18,347 | – | – |
| 2016 Limited Edition Silver Proof Sets | 35,603 | 36,183 | 580 | 1.63% |
| 2014 Limited Edition Silver Proof Sets* | 42,614 | 42,614 | – | – |
US Mint Uncirculated Sets |
||||
| Old Sales |
Latest Sales |
Gain/ Loss |
% Increase |
|
| 2016 American $1 Coin and Currency Set | 46,430 | 46,537 | 107 | 0.23% |
| 2015 American $1 Coin and Currency Set* | 88,805 | 88,805 | – | – |
| 2014 American $1 Coin and Currency Set* | 50,000 | 50,000 | – | – |
| 2016 Uncirculated Mint Sets | 268,495 | 269,491 | 996 | 0.37% |
| 2015 Uncirculated Mint Sets* | 314,036 | 314,032 | -4 | 0.00% |
| 2014 Uncirculated Mint Sets* | 345,813 | 345,813 | – | – |
| 2013 Uncirculated Mint Sets* | 376,844 | 376,844 | – | – |
| 2016 Presidential $1 Coin Uncirculated Sets | 51,856 | 52,125 | 269 | 0.52% |
| 2015 Presidential $1 Coin Uncirculated Sets | 59,914 | 60,008 | 94 | 0.16% |
| 2014 Presidential $1 Coin Uncirculated Sets | 63,470 | 63,535 | 65 | 0.10% |
| 2013 Presidential $1 Coin Uncirculated Sets* | 75,846 | 75,846 | – | – |
| 2012 Presidential $1 Coin Uncirculated Sets* | 99,743 | 99,743 | – | – |
| 2011 Presidential $1 Coin Uncirculated Sets | 85,613 | 85,634 | 21 | 0.02% |
| 2016 Annual Uncirculated Dollar Coin Sets | 14,764 | 15,115 | 351 | 2.38% |
| 2015 Annual Uncirculated Dollar Coin Sets* | 22,691 | 22,691 | – | – |
| 2014 Annual Uncirculated Dollar Coin Sets* | 28,637 | 28,637 | – | – |
| 2013 Annual Uncirculated Dollar Coin Sets* | 43,150 | 43,150 | – | – |
| 2013 Theodore Roosevelt Presidential Discovery Sets | 10,206 | 10,214 | 8 | 0.08% |
Coin Discovery Set |
||||
| Old Sales |
Latest Sales |
Gain/ Loss |
% Increase |
|
| 2014 | 8,329 | 8,342 | 13 | 0.16% |
Proof Silver Eagles |
||||
| Old Sales |
Latest Sales |
Gain/ Loss |
% Increase |
|
| 2016-W Proof Silver Eagles | 529,521 | 530,887 | 1,366 | 0.26% |
| 2015-W Proof Silver Eagles* | 699,623 | 699,623 | – | – |
| 2014-W Proof Silver Eagles* | 894,614 | 894,614 | – | – |
| 2013-W Proof Silver Eagles* | 868,494 | 868,494 | – | – |
Uncirculated Silver Eagles |
||||
| Old Sales |
Latest Sales |
Gain/ Loss |
% Increase |
|
| 2016 | 168,171 | 167,753 | -418 | -0.25% |
| 2015* | 201,188 | 201,188 | – | – |
| 2014* | 224,532 | 224,532 | – | – |
| 2013* | 178,941 | 178,941 | – | – |
2016 Proof American Eagle Gold Coins |
||||
| Old Sales |
Latest Sales |
Gain/ Loss |
% Increase |
|
| 1 oz | 22,311 | 22,902 | 591 | 2.65% |
| 1/2 oz | 5,429 | 5,463 | 34 | 0.63% |
| 1/4 oz* | 7,135 | 7,135 | – | – |
| 1/10 oz* | 21,619 | 21,619 | – | – |
| 4-Coin Set | 15,934 | 16,231 | 297 | 1.86% |
2015 Proof American Eagle Gold Coins |
||||
| Old Sales |
Latest Sales |
Gain/ Loss |
% Increase |
|
| 1 oz* | 22,734 | 22,734 | – | – |
| 1/2 oz* | 5,903 | 5,902 | – | – |
| 1/4 oz* | 5,857 | 5,857 | – | – |
| 1/10 oz* | 16,851 | 16,851 | – | – |
| 4-Coin Set* | 9,918 | 9,918 | – | – |
Uncirculated American Eagle Gold Coins |
||||
| Old Sales |
Latest Sales |
Gain/ Loss |
% Increase |
|
| 2016* | 6,887 | 6,887 | – | – |
| 2015* | 6,531 | 6,533 | – | – |
| 2014* | 7,902 | 7,902 | – | – |
| 2013* | 7,293 | 7,293 | – | – |
Proof American Buffalo Gold Coins |
||||
| Old Sales |
Latest Sales |
Gain/ Loss |
% Increase |
|
| 2016 Proof Gold Buffalo* | 21,878 | 21,878 | – | – |
| 2015 Proof Gold Buffalo* | 16,591 | 16,591 | – | – |
| 2014 Proof Gold Buffalo* | 20,557 | 20,557 | – | – |
Proof American Platinum Eagle |
||||
| Old Sales |
Latest Sales |
Gain/ Loss |
% Increase |
|
| 2016* | 9,151 | 9,151 | – | – |
| 2015* | 3,881 | 3,881 | – | – |
| 2014* | 4,596 | 4,596 | – | – |
America the Beautiful 5 Oz Silver Coins |
||||
| Old Sales |
Latest Sales |
Gain/ Loss |
% Increase |
|
| 2016-P Fort Moultrie Silver Coins | 15,131 | 15,494 | 363 | 2.40% |
| 2016-P Theodore Roosevelt Silver Coins* | 18,917 | 18,917 | – | – |
| 2016-P Harpers Ferry Silver Coins | 18,894 | 18,898 | 4 | 0.02% |
| 2016-P Cumberland Gap Silver Coins* | 18,713 | 18,713 | – | – |
| 2016-P Shawnee Silver Coins* | 18,781 | 18,781 | – | – |
| 2015-P Saratoga Silver Coins* | 17,563 | 17,563 | – | – |
| 2015-P Bombay Hook Silver Coins* | 17,309 | 17,309 | – | – |
| 2015-P Blue Ridge Parkway Silver Coins* | 17,461 | 17,461 | – | – |
| 2015-P Kisatchie Silver Coins* | 19,449 | 19,449 | – | – |
| 2015-P Homestead Silver Coins* | 21,283 | 21,286 | – | – |
| 2014-P Everglades Silver Coins* | 22,732 | 22,732 | – | – |
| 2014-P Great Sand Dunes Silver Coins* | 24,103 | 24,103 | – | – |
| 2014-P Arches Silver Coins* | 28,434 | 28,434 | – | – |
| 2014-P Shenandoah Silver Coins* | 28,451 | 28,451 | – | – |
| 2014-P Great Smoky Mountains Silver Coins* | 24,710 | 24,710 | – | – |
| 2013-P White Mountain Silver Coins* | 20,530 | 20,530 | – | – |
| 2013-P Perry’s Victory Silver Coins* | 17,707 | 17,707 | – | – |
| 2013-P Great Basin Silver Coins* | 17,792 | 17,792 | – | – |
| 2013-P Fort McHenry Silver Coins* | 19,802 | 19,802 | – | – |
| 2013-P Mount Rushmore Silver Coins* | 23,547 | 23,547 | – | – |
First Spouse Gold Coins |
||||
| Old Sales |
Latest Sales |
Gain/ Loss |
% Increase |
|
| Nancy Reagan Proof (2016) | 3,314 | 3,327 | 13 | 0.39% |
| Nancy Reagan Uncirculated (2016) | 1,776 | 1,784 | 8 | 0.45% |
| Betty Ford Proof (2016) | 2,232 | 2,243 | 11 | 0.49% |
| Betty Ford Uncirculated (2016) | 1,517 | 1,507 | -10 | -0.66% |
| Pat Nixon Proof (2016) | 2,462 | 2,465 | 3 | 0.12% |
| Pat Nixon Uncirculated (2016) | 1,548 | 1,550 | 2 | 0.13% |
| Lady Bird Johnson Proof (2015) | 2,617 | 2,621 | 4 | 0.15% |
| Lady Bird Johnson Uncirculated (2015) | 1,734 | 1,739 | 5 | 0.29% |
| Jacqueline Kennedy Proof (2015)* | 11,222 | 11,222 | – | – |
| Jacqueline Kennedy Uncirculated (2015) | 6,482 | 6,503 | 21 | 0.32% |
| Mamie Eisenhower Proof (2015) | 2,704 | 2,704 | – | – |
| Mamie Eisenhower Uncirculated (2015) | 1,921 | 1,923 | 2 | 0.10% |
| Bess Truman Proof (2015) | 2,598 | 2,599 | 1 | 0.04% |
| Bess Truman Uncirculated (2015) | 1,816 | 1,825 | 9 | 0.50% |
| Eleanor Roosevelt Proof (2014)* | 2,377 | 2,377 | – | – |
| Eleanor Roosevelt Uncirculated (2014)* | 1,886 | 1,886 | – | – |
| Lou Hoover Proof (2014)* | 2,392 | 2,392 | – | – |
| Lou Hoover Uncirculated (2014)* | 1,936 | 1,936 | – | – |
| Grace Coolidge Proof (2014)* | 2,315 | 2,315 | – | – |
| Grace Coolidge Uncirculated (2014)* | 1,949 | 1,949 | – | – |
| Florence Harding Proof (2014)* | 2,372 | 2,372 | – | – |
| Florence Harding Uncirculated (2014)* | 1,944 | 1,944 | – | – |
| Edith Wilson Proof (2013)* | 2,464 | 2,464 | – | – |
| Edith Wilson Uncirculated (2013)* | 1,974 | 1,974 | – | – |
| Ellen Wilson Proof (2013)* | 2,511 | 2,511 | – | – |
| Ellen Wilson Uncirculated (2013)* | 1,980 | 1,980 | – | – |
| Helen Taft Proof (2013)* | 2,598 | 2,598 | – | – |
| Helen Taft Uncirculated (2013)* | 1,993 | 1,993 | – | – |
| Edith Roosevelt Proof (2013)* | 2,840 | 2,840 | – | – |
| Edith Roosevelt Uncirculated (2013)* | 2,027 | 2,027 | – | – |
| Ida McKinley Proof (2013)* | 2,724 | 2,724 | – | – |
| Ida McKinley Uncirculated (2013)* | 2,008 | 2,008 | – | – |
| Alice Paul Proof (2012)* | 3,505 | 3,505 | – | – |
| Alice Paul Uncirculated (2012)* | 2,798 | 2,798 | – | – |
| Frances Cleveland Proof (2012, 1st Term)* | 3,158 | 3,158 | – | – |
| Frances Cleveland Uncirculated (2012 1st Term)* | 2,454 | 2,454 | – | – |
| Caroline Harrison Proof (2012)* | 3,046 | 3,046 | – | – |
| Caroline Harrison Uncirculated (2012)* | 2,436 | 2,436 | – | – |
| Frances Cleveland Proof (2012, 2nd Term)* | 3,104 | 3,104 | – | – |
| Frances Cleveland Uncirculated (2012 2nd Term)* | 2,425 | 2,425 | – | – |
Presidential $1 Coin Sets |
||||
| Old Sales |
Latest Sales |
Gain/ Loss |
% Increase |
|
| 2016-P | 8,988 | 9,067 | 79 | 0.88% |
| 2016-D | 7,026 | 7,026 | – | – |
| 2015-P | 12,135 | 12,173 | 38 | 0.31% |
| 2015-D | 10,358 | 10,375 | 17 | 0.16% |
| 2014-P | 13,332 | 13,351 | 19 | 0.14% |
| 2014-D | 9,920 | 9,938 | 18 | 0.18% |
| 2013-P* | 17,771 | 17,771 | – | – |
| 2013-D | 14,923 | 14,923 | – | – |
Presidential Coins & First Spouse Medal Sets |
||||
| Old Sales |
Latest Sales |
Gain/ Loss |
% Increase |
|
| Reagan | 12,370 | 12,405 | 35 | 0.28% |
| Ford | 6,039 | 6,057 | 18 | 0.30% |
| Nixon | 7,106 | 7,124 | 18 | 0.25% |
| Johnson | 7,424 | 7,431 | 7 | 0.09% |
| Kennedy* | 24,183 | 24,183 | – | – |
| Eisenhower | 9,404 | 9,411 | 7 | 0.07% |
| Truman | 8,092 | 8,096 | 4 | 0.05% |
| Roosevelt* | 7,000 | 7,000 | – | – |
| Hoover* | 4,500 | 4,500 | – | – |
| Coolidge* | 4,500 | 4,500 | – | – |
| Harding* | 4,500 | 4,500 | – | – |
| Edith Wilson | 3,979 | 3,979 | – | – |
| Ellen Wilson | 3,998 | 3,998 | – | – |
| Helen Taft | 3,994 | 3,994 | – | – |
| Edith Roosevelt | 5,002 | 5,002 | – | – |
| Ida McKinley | 3,994 | 3,994 | – | – |
| Abigail Fillmore | 11,136 | 11,138 | 2 | 0.02% |
| Jane Pierce | 8,901 | 8,902 | 1 | 0.01% |
| Buchanan’s Liberty | 8,928 | 8,931 | 3 | 0.03% |
| Mary Todd Lincoln* | 15,858 | 15,858 | – | – |
| Eliza Johnson | 7,242 | 7,243 | 1 | 0.01% |
| Julia Grant | 7,978 | 7,981 | 3 | 0.04% |
| Lucy Hayes | 6,282 | 6,283 | 1 | 0.02% |
| Lucretia Garfield | 6,053 | 6,054 | 1 | 0.02% |
| Alice Paul | 5,998 | 6,001 | 3 | 0.05% |
| Frances Cleveland (1st) | 5,466 | 5,469 | 3 | 0.05% |
| Caroline Harrison | 5,371 | 5,376 | 5 | 0.09% |
| Frances Cleveland (2nd) | 5,240 | 5,245 | 5 | 0.10% |
Presidential $1 Coin Covers |
||||
| Old Sales |
Latest Sales |
Gain/ Loss |
% Increase |
|
| Ronald Reagan | 17,931 | 17,975 | 44 | 0.25% |
| Gerald R. Ford | 12,137 | 12,143 | 6 | 0.05% |
| Richard M. Nixon | 13,749 | 13,770 | 21 | 0.15% |
| Lyndon B. Johnson | 13,196 | 13,207 | 11 | 0.08% |
| John F. Kennedy | 22,669 | 22,675 | 6 | 0.03% |
| Dwight D. Eisenhower* | 14,823 | 14,823 | – | – |
| Harry S. Truman | 14,788 | 14,788 | – | – |
| Franklin Roosevelt | 14,854 | 14,858 | 4 | 0.03% |
| Herbert Hoover | 12,373 | 12,374 | 1 | 0.01% |
| Calvin Coolidge | 12,890 | 12,892 | 2 | 0.02% |
| Warren G. Harding | 13,050 | 13,051 | 1 | 0.01% |
| William Henry Harrison | 30,837 | 30,837 | – | – |
| John Tyler | 27,470 | 27,470 | – | – |
| James K. Polk | 25,703 | 25,703 | – | – |
| Zachary Taylor | 24,669 | 24,669 | – | – |
| Millard Fillmore | 23,821 | 23,822 | 1 | 0.00% |
| Franklin Pierce | 22,265 | 22,266 | 1 | 0.00% |
| James Buchanan | 20,999 | 21,001 | 2 | 0.01% |
| Abraham Lincoln* | 36,783 | 36,783 | – | – |
| Andrew Johnson | 19,463 | 19,468 | 5 | 0.03% |
| Ulysses S. Grant | 20,207 | 20,212 | 5 | 0.02% |
| Rutherford B. Hayes | 17,685 | 17,689 | 4 | 0.02% |
| James Garfield | 16,840 | 16,841 | 1 | 0.01% |
| Chester Arthur | 17,042 | 17,048 | 6 | 0.04% |
| Grover Cleveland (1st) | 15,479 | 15,482 | 3 | 0.02% |
| Benjamin Harrison | 15,124 | 15,130 | 6 | 0.04% |
| Grover Cleveland (2nd) | 14,395 | 14,398 | 3 | 0.02% |
| William McKinley | 14,722 | 14,726 | 4 | 0.03% |
| Theodore Roosevelt | 17,240 | 17,250 | 10 | 0.06% |
| William Howard Taft | 13,631 | 13,634 | 3 | 0.02% |
| Woodrow Wilson | 13,246 | 13,252 | 6 | 0.05% |
2016 Ronald Reagan $1 Coin Rolls, Bags, Boxes |
||||
| Old Sales |
Latest Sales |
Gain/ Loss |
% Increase |
|
| 25-coin roll set (P) | 43,822 | 43,959 | 137 | 0.31% |
| 25-coin roll set (D) | 39,923 | 39,997 | 74 | 0.19% |
| 100-coin bag (P) | 1,890 | 1,899 | 9 | 0.48% |
| 100-coin bag (D) | 1,753 | 1,759 | 6 | 0.34% |
| 250-coin box (P) | 6,709 | 6,727 | 18 | 0.27% |
| 250-coin box (D) | 6,091 | 6,109 | 18 | 0.30% |
2016 Gerald R. Ford $1 Coin Rolls, Bags, Boxes |
||||
| Old Sales |
Latest Sales |
Gain/ Loss |
% Increase |
|
| 25-coin roll set (P) | 42,769 | 42,824 | 55 | 0.13% |
| 25-coin roll set (D) | 38,437 | 38,464 | 27 | 0.07% |
| 100-coin bag (P) | 2,561 | 2,561 | – | – |
| 100-coin bag (D) | 1,069 | 1,069 | – | – |
| 250-coin box (P) | 4,670 | 4,674 | 4 | 0.09% |
| 250-coin box (D) | 4,548 | 4,552 | 4 | 0.09% |
2016 Richard M. Nixon $1 Coin Rolls, Bags, Boxes |
||||
| Old Sales |
Latest Sales |
Gain/ Loss |
% Increase |
|
| 25-coin roll set (P) | 44,603 | 44,641 | 38 | 0.09% |
| 25-coin roll set (D) | 38,876 | 38,905 | 29 | 0.07% |
| 100-coin bag (P) | 2,649 | 2,650 | 1 | 0.04% |
| 100-coin bag (D) | 1,222 | 1,224 | 2 | 0.16% |
| 250-coin box (P) | 5,008 | 5,014 | 6 | 0.12% |
| 250-coin box (D) | 4,909 | 4,916 | 7 | 0.14% |
2015 Lyndon B. Johnson $1 Coin Rolls, Bags, Boxes |
||||
| Old Sales |
Latest Sales |
Gain/ Loss |
% Increase |
|
| 25-coin roll set (P)* | 40,000 | 40,000 | – | – |
| 25-coin roll set (D)* | 37,742 | 37,742 | – | – |
| 100-coin bag (P) | 1,617 | 1,622 | 5 | 0.31% |
| 100-coin bag (D) | 1,553 | 1,553 | – | – |
| 250-coin box (P) | 4,688 | 4,688 | – | – |
| 250-coin box (D) | 6,058 | 6,063 | 5 | 0.08% |
2015 John F. Kennedy $1 Coin Rolls, Bags, Boxes |
||||
| Old Sales |
Latest Sales |
Gain/ Loss |
% Increase |
|
| 25-coin roll set (P) | 51,856 | 51,894 | 38 | 0.07% |
| 25-coin roll set (D) | 46,710 | 46,737 | 27 | 0.06% |
| 100-coin bag (P) | 2,482 | 2,494 | 12 | 0.48% |
| 100-coin bag (D) | 2,362 | 2,378 | 16 | 0.68% |
| 250-coin box (P) | 7,576 | 7,588 | 12 | 0.16% |
| 250-coin box (D) | 6,957 | 6,969 | 12 | 0.17% |
2015 Dwight D. Eisenhower $1 Coin Rolls, Bags, Boxes |
||||
| Old Sales |
Latest Sales |
Gain/ Loss |
% Increase |
|
| 25-coin roll set (P)* | 39,729 | 39,729 | – | – |
| 25-coin roll set (D)* | 37,728 | 37,728 | – | – |
| 100-coin bag (P) | 2,332 | 2,341 | 9 | 0.39% |
| 100-coin bag (D) | 2,239 | 2,245 | 6 | 0.27% |
| 250-coin box (P) | 7,760 | 7,764 | 4 | 0.05% |
| 250-coin box (D) | 6,068 | 6,071 | 3 | 0.05% |
2015 Harry S. Truman $1 Coin Rolls, Bags, Boxes |
||||
| Old Sales |
Latest Sales |
Gain/ Loss |
% Increase |
|
| 25-coin roll set (P)* | 39,686 | 39,686 | – | – |
| 25-coin roll set (D)* | 37,655 | 37,655 | – | – |
| 100-coin bag (P)* | 3,491 | 3,491 | – | – |
| 100-coin bag (D)* | 3,334 | 3,334 | – | – |
| 250-coin box (P) | 8,089 | 8,093 | 4 | 0.05% |
| 250-coin box (D) | 6,276 | 6,281 | 5 | 0.08% |
2014 Franklin Roosevelt $1 Coin Rolls, Bags, Boxes |
||||
| Old Sales |
Latest Sales |
Gain/ Loss |
% Increase |
|
| 25-coin roll set (P) | 58,285 | 58,303 | 18 | 0.03% |
| 25-coin roll set (D) | 52,936 | 52,949 | 13 | 0.02% |
| 100-coin bag (P)* | 1,986 | 1,986 | – | – |
| 100-coin bag (D)* | 1,968 | 1,968 | – | – |
| 250-coin box (P)* | 6,977 | 6,977 | – | – |
| 250-coin box (D)* | 5,025 | 5,025 | – | – |
2014 Herbert Hoover $1 Coin Rolls, Bags, Boxes |
||||
| Old Sales |
Latest Sales |
Gain/ Loss |
% Increase |
|
| 25-coin roll set (P) | 52,736 | 52,750 | 14 | 0.03% |
| 25-coin roll set (D) | 45,820 | 45,827 | 7 | 0.02% |
| 100-coin bag (P)* | 1,978 | 1,978 | – | – |
| 100-coin bag (D)* | 1,990 | 1,990 | – | – |
| 250-coin box (P) | 6,994 | 6,994 | – | – |
| 250-coin box (D)* | 5,050 | 5,050 | – | – |
Native American Dollar Rolls |
||||
| Old Sales |
Latest Sales |
Gain/ Loss |
% Increase |
|
| 2016-dated 25-coin roll set (P) | 16,703 | 16,755 | 52 | 0.31% |
| 2016-dated 25-coin roll set (D) | 16,353 | 16,397 | 44 | 0.27% |
| 2016-dated 100-coin bag (P) | 1,501 | 1,516 | 15 | 1.00% |
| 2016-dated 100-coin bag (D) | 1,516 | 1,529 | 13 | 0.86% |
| 2016-dated 250-coin box (P) | 1,635 | 1,677 | 42 | 2.57% |
| 2016-dated 250-coin box (D) | 1,775 | 1,781 | 6 | 0.34% |
| 2015-dated 25-coin roll set (P) | 18,409 | 18,441 | 32 | 0.17% |
| 2015-dated 25-coin roll set (D) | 18,716 | 18,729 | 13 | 0.07% |
| 2015-dated 100-coin bag (P) | 2,415 | 2,415 | – | – |
| 2015-dated 100-coin bag (D) | 2,454 | 2,454 | – | – |
| 2015-dated 250-coin box (P) | 2,218 | 2,218 | – | – |
| 2015-dated 250-coin box (D) | 2,158 | 2,161 | 3 | 0.14% |
| 2014-dated 25-coin roll set (P)* | 19,173 | 19,173 | – | – |
| 2014-dated 25-coin roll set (D)* | 19,113 | 19,113 | – | – |
| 2014-dated 100-coin bag (P)* | 1,987 | 1,987 | – | – |
| 2014-dated 100-coin bag (D)* | 1,990 | 1,990 | – | – |
| 2014-dated 250-coin box (P)* | 2,611 | 2,611 | – | – |
| 2014-dated 250-coin box (D)* | 2,480 | 2,480 | – | – |
| 2013-dated 25-coin roll set (P)* | 24,914 | 24,914 | – | – |
| 2013-dated 25-coin roll set (D)* | 23,864 | 23,864 | – | – |
| 2013-dated 100-coin bag (P)* | 1,481 | 1,481 | – | – |
| 2013-dated 100-coin bag (D)* | 1,478 | 1,478 | – | – |
| 2013-dated 250-coin box (P)* | 2,508 | 2,508 | – | – |
| 2013-dated 250-coin box (D)* | 2,496 | 2,496 | – | – |
| 2013-dated 500-coin box (P)* | 498 | 498 | – | – |
| 2013-dated 500-coin box (D)* | 494 | 494 | – | – |
Kennedy Half Dollar Rolls |
||||
| Old Sales |
Latest Sales |
Gain/ Loss |
% Increase |
|
| 2016-dated 200-coin bag (P&D) | 9,125 | 9,291 | 166 | 1.82% |
| 2016-dated 2-roll set (P&D) | 21,083 | 21,179 | 96 | 0.46% |
| 2015-dated 200-coin bag (P&D) | 13,454 | 13,504 | 50 | 0.37% |
| 2015-dated 2-roll set (P&D) | 27,621 | 27,663 | 42 | 0.15% |
| 2014-dated 200-coin bag (P&D)* | 12,967 | 12,967 | – | – |
| 2014-dated 2-roll set (P&D)* | 30,331 | 30,331 | – | – |
| 2013-dated 200-coin bag (P&D)* | 9,980 | 9,980 | – | – |
| 2013-dated 2-roll set (P&D)* | 24,918 | 24,918 | – | – |
| 2012-dated 200-coin bag (P&D)* | 10,323 | 10,323 | – | – |
| 2012-dated 2-roll set (P&D)* | 33,766 | 33,766 | – | – |
America the Beautiful Quarters Uncirculated Coin Set |
||||
| Old Sales |
Latest Sales |
Gain/ Loss |
% Increase |
|
| 2016 Issue | 29,559 | 29,559 | – | – |
| 2015 Issue | 27,818 | 27,846 | 28 | 0.10% |
| 2014 Issue | 29,847 | 29,869 | 22 | 0.07% |
| 2013 Issue | 42,539 | 42,552 | 13 | 0.03% |
| 2012 Issue* | 42,223 | 42,223 | – | – |
| 2011 Issue | 40,253 | 40,266 | 13 | 0.03% |
| 2010 Issue | 41,582 | 41,598 | 16 | 0.04% |
America the Beautiful Quarters Circulating Coin Set |
||||
| Old Sales |
Latest Sales |
Gain/ Loss |
% Increase |
|
| 2016 Issue | 17,050 | 17,249 | 199 | 1.17% |
| 2015 Issue | 21,046 | 21,081 | 35 | 0.17% |
| 2014 Issue | 23,561 | 23,584 | 23 | 0.10% |
| 2013 Issue | 29,013 | 29,033 | 20 | 0.07% |
| 2012 Issue* | 24,869 | 24,869 | – | – |
| 2011 Issue | 36,250 | 36,278 | 28 | 0.08% |
| 2010 Issue | 39,760 | 39,788 | 28 | 0.07% |
America the Beautiful Quarters Three-Coin Sets |
||||
| Old Sales |
Latest Sales |
Gain/ Loss |
% Increase |
|
| Fort Moultrie | 11,252 | 11,380 | 128 | 1.14% |
| Theodore Roosevelt | 14,123 | 14,188 | 65 | 0.46% |
| Harpers Ferry | 12,889 | 12,928 | 39 | 0.30% |
| Cumberland Gap | 13,765 | 13,796 | 31 | 0.23% |
| Shawnee | 14,234 | 14,270 | 36 | 0.25% |
| Saratoga | 14,616 | 14,628 | 12 | 0.08% |
| Bombay Hook | 13,125 | 13,129 | 4 | 0.03% |
| Blue Ridge Parkway | 16,811 | 16,816 | 5 | 0.03% |
| Kisatchie Set | 14,896 | 14,898 | 2 | 0.01% |
| Homestead Set | 15,865 | 15,876 | 11 | 0.07% |
| Everglades Set | 14,110 | 14,115 | 5 | 0.04% |
| Great Sand Dunes Set | 13,862 | 13,864 | 2 | 0.01% |
| Arches Three-Coin Set | 15,534 | 15,539 | 5 | 0.03% |
| Shenandoah Three-Coin Set | 17,109 | 17,111 | 2 | 0.01% |
| Great Smoky Mountains Set | 18,588 | 18,588 | – | – |
| Mount Rushmore Quarters Set | 17,461 | 17,470 | 9 | 0.05% |
| Fort McHenry Quarters Set | 16,052 | 16,061 | 9 | 0.06% |
| Great Basin Quarters Set | 15,295 | 15,300 | 5 | 0.03% |
| Perry’s Victory Quarters Set | 17,397 | 17,400 | 3 | 0.02% |
| White Mountain Quarters Set | 18,056 | 18,056 | – | – |
| Denali Quarters Set | 17,787 | 17,793 | 6 | 0.03% |
| Hawaii Volcanoes Quarters Set* | 16,508 | 16,647 | – | – |
| Acadia Quarters Set | 19,940 | 19,940 | – | – |
| Chaco Culture Quarters Set | 19,602 | 19,610 | 8 | 0.04% |
| El Yunque Quarters Set* | 19,891 | 19,891 | – | – |
| Chickasaw Quarters Set | 15,985 | 15,988 | 3 | 0.02% |
| Vicksburg Quarters Set | 17,868 | 17,873 | 5 | 0.03% |
| Olympic Quarters Set | 17,494 | 17,496 | 2 | 0.01% |
| Glacier Quarters Set | 18,765 | 18,770 | 5 | 0.03% |
| Gettysburg Quarters Set | 22,451 | 22,456 | 5 | 0.02% |
| Mount Hood Quarters Set | 18,167 | 18,170 | 3 | 0.02% |
| Grand Canyon Quarters Set | 21,805 | 21,813 | 8 | 0.04% |
| Yosemite Quarters Set | 21,831 | 21,838 | 7 | 0.03% |
| Yellowstone Quarters Set | 24,693 | 24,704 | 11 | 0.04% |
| Hot Springs Quarters Set | 22,987 | 22,990 | 3 | 0.01% |
2016 Fort Moultrie Quarters |
||||
| Old Sales |
Latest Sales |
Gain/ Loss |
% Increase |
|
| 100-Coin Bag (S) | 3,919 | 3,973 | 54 | 1.38% |
| 40-Coin Roll (S) | 3,633 | 3,662 | 29 | 0.80% |
| Three-Roll Set | 8,166 | 8,227 | 61 | 0.75% |
| 100-Coin Bag (P) | 2,086 | 2,096 | 10 | 0.48% |
| 100-Coin Bag (D) | 2,018 | 2,026 | 8 | 0.40% |
| Two-Roll Set | 6,708 | 6,724 | 16 | 0.24% |
2016 Theodore Roosevelt Quarters |
||||
| Old Sales |
Latest Sales |
Gain/ Loss |
% Increase |
|
| 100-Coin Bag (S) | 4,456 | 4,559 | 103 | 2.31% |
| 40-Coin Roll (S) | 4,215 | 4,238 | 23 | 0.55% |
| Three-Roll Set | 9,064 | 9,091 | 27 | 0.30% |
| 100-Coin Bag (P) | 2,270 | 2,263 | -7 | -0.31% |
| 100-Coin Bag (D) | 2,111 | 2,114 | 3 | 0.14% |
| Two-Roll Set | 7,344 | 7,360 | 16 | 0.22% |
2016 Harpers Ferry Quarters |
||||
| Old Sales |
Latest Sales |
Gain/ Loss |
% Increase |
|
| 100-Coin Bag (S) | 4,421 | 4,455 | 34 | 0.77% |
| 40-Coin Roll (S) | 4,224 | 4,244 | 20 | 0.47% |
| Three-Roll Set | 9,134 | 9,147 | 13 | 0.14% |
| 100-Coin Bag (P) | 2,148 | 2,150 | 2 | 0.09% |
| 100-Coin Bag (D) | 2,073 | 2,075 | 2 | 0.10% |
| Two-Roll Set | 7,586 | 7,592 | 6 | 0.08% |
2016 Cumberland Gap Quarters |
||||
| Old Sales |
Latest Sales |
Gain/ Loss |
% Increase |
|
| 100-Coin Bag (S) | 4,379 | 4,445 | 66 | 1.51% |
| 40-Coin Roll (S) | 4,245 | 4,259 | 14 | 0.33% |
| Three-Roll Set | 9,188 | 9,200 | 12 | 0.13% |
| 100-Coin Bag (P) | 2,255 | 2,256 | 1 | 0.04% |
| 100-Coin Bag (D) | 2,208 | 2,210 | 2 | 0.09% |
| Two-Roll Set | 7,408 | 7,413 | 5 | 0.07% |
2016 Shawnee Quarters |
||||
| Old Sales |
Latest Sales |
Gain/ Loss |
% Increase |
|
| 100-Coin Bag (S) | 4,697 | 4,732 | 35 | 0.75% |
| 40-Coin Roll (S) | 4,388 | 4,400 | 12 | 0.27% |
| Three-Roll Set | 9,603 | 9,617 | 14 | 0.15% |
| 100-Coin Bag (P) | 2,211 | 2,212 | 1 | 0.05% |
| 100-Coin Bag (D) | 2,160 | 2,161 | 1 | 0.05% |
| Two-Roll Set | 7,594 | 7,603 | 9 | 0.12% |
2015 Saratoga Quarters |
||||
| Old Sales |
Latest Sales |
Gain/
Loss |
% Increase |
|
| 100-Coin Bag (S) | 4,869 | 4,869 | – | – |
| 40-Coin Roll (S) | 4,542 | 4,542 | – | – |
| Three-Roll Set | 9,423 | 9,423 | – | – |
| 100-Coin Bag (P) | 2,259 | 2,259 | – | – |
| 100-Coin Bag (D) | 2,212 | 2,212 | – | – |
| Two-Roll Set | 7,541 | 7,541 | – | – |
Visit the United States Mint website at http://catalog.usmint.gov for product information.