U.S. circulating coin production slowed in November for a second month in a row and dropped below the 1 billion mark for the first time since February, the latest figures from the United States Min show.
Year-end slides are mostly the norm and the latest one will extend into December as the U.S. Mint gears up to strike coins for 2016.
As far as headline comparisons across pennies, nickels, dimes and quarters, the Mint struck just over 976 million of them for declines of 24.8% from October and 21.7% from November of last year.
Here’s how the month stacks up against others in the past year:
November 2015 to November 2016 Coin Production Figures
| Month | Mintages | Rank |
| November 2016 | 976.04 M | 11 |
| October 2016 | 1,297.36 M | 9 |
| September 2016 | 1,573.70 M | 3 |
| August 2016 | 1,302.95 M | 8 |
| July 2016 | 1,807.20 M | 1 |
| June 2016 | 1,582.06 M | 2 |
| May 2016 | 1,550.12 M | 4 |
| April 2016 | 1,339.06 M | 7 |
| March 2016 | 1,446.14 M | 6 |
| February 2016 | 930.26 M | 12 |
| January 2016 | 1,515.84 M | 5 |
| December 2015 | 707.79 M | 13 |
| November 2015 | 1,245.73 M | 10 |
The Federal Reserve always orders more Lincoln cents from the United States Mint than any other denomination even as it costs about 1.4 cents to make and distribute each one. The U.S. Mint struck a combined 609.6 million of them in November, representing 62.5% of the circulating-quality coins produced for the month.
In the latest month-over month comparisons for coins used daily by Americans, production totals declined:
- 25.3% Lincoln cents,
- 9% Jefferson nickels,
- 17% Roosevelt dimes, and
- 44.7% America the Beautiful Quarters.
Presidential $1 Coins, Native American $1 Coins and Kennedy half-dollars are no longer ordered by Federal Reserve Banks for distribution but the U.S. Mint continues to make them in circulating quality for coin collectors.
In January, the U.S. Mint produced Native American $1 Coins to the expected amounts needed for all of 2016. That is usually how it works for Kennedy half-dollars but in February another 400,000 were pressed at the Philadelphia Mint and then in March another 400,000 were made at the Denver Mint. In October, the Philadelphia Mint reported that Reagan dollars increased by 420,000.
Here’s a summary of all circulating-quality coins produced last month:
US Mint Circulating Coin Production in November 2016
| Denomination | Denver | Philadelphia | Total |
| Lincoln Cents | 351,200,000 | 258,400,000 | 609,600,000 |
| Jefferson Nickels | 63,120,000 | 58,320,000 | 121,440,000 |
| Roosevelt Dimes | 90,000,000 | 69,000,000 | 159,000,000 |
| 2016 ATB Quarters | 40,400,000 | 45,600,000 | 86,000,000 |
| Kennedy Half Dollars | 0 | 0 | 0 |
| Native American $1s | 0 | 0 | 0 |
| Presidential Dollars | 0 | 0 | 0 |
| Total | 544,720,000 | 431,320,000 | 976,040,000 |
Facilities in Denver and Philadelphia manufacture all U.S. coins for commerce. In November, the two plants made 544.72 million and 431.32 million coins, respectively.
Year To Date
Year to date, the Denver Mint pressed 7,501,160,000 coins and the Philadelphia Mint struck 7,819,570,000 coins for a combined 15,320,730,000 coins. That’s 6.2% fewer than the 16,338,910,000 coins minted by this time last year.
This next table lists 2016 coin production totals by denomination and by U.S. Mint facility:
YTD 2016 Circulating Coin Production by Denomination
| 1 ¢ | 5 ¢ | 10 ¢ | 25 ¢ | 50 ¢ | N.A. $1 | Pres $1 | Total: | |
|---|---|---|---|---|---|---|---|---|
| Denver | 4288.4M | 738M | 1370.5M | 1084.8M | 2.1M | 2.1M | 15.26M | 7501.16M |
| Philadelphia | 4489.2M | 754.08M | 1442.5M | 1110.83M | 2.1M | 2.8M | 18.06M | 7819.57M |
| Total | 877.6M | 1492.08M | 2813M | 2195.63M | 4.2M | 4.9M | 33.32M | 15320.73M |
This year’s monthly average of about 1.39 billion coins tracks over 12 months to over 16.7 billion coins. As a resent comparison, the U.S. Mint in 2015 made just over 17 billion coins for a sixth straight year of growth and the fastest production pace since the 2001.
Coins by Design
Beginning in September and specific to this year’s last two quarter designs, the U.S. Mint started publishing partial production figures. In the past, the agency reported totals for quarters only after they had finished making them.
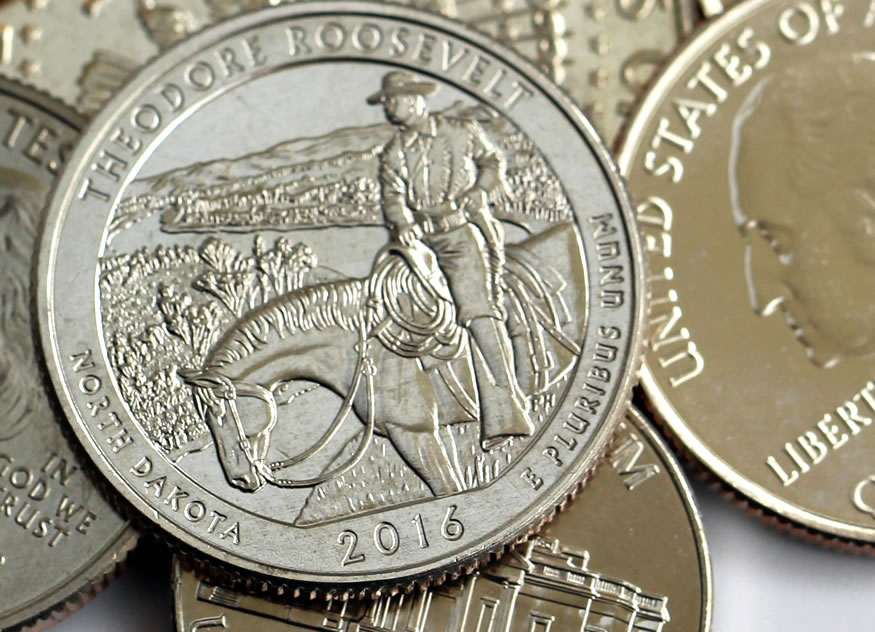
That said, it appears mintages are finalized for North Dakota’s Theodore Roosevelt National Park quarter. Its figures remained the same for a second month in a row, suggesting final mintages of 223.2 million from Denver and 231.6 million from Philadelphia for a combined 454.8 million. That’s 47% lower than the previous Harpers Ferry quarter, which ended with 858.63 million — the highest total among quarters since the 2001 release featuring Vermont.
The following table summarizes this year’s mintages by coin design:
2016 Circulating Coin Production by Design
| Denver | Philadelphia | Total | |
| Lincoln Cents | 4,288,400,000 | 4,489,200,000 | 8,777,600,000 |
| Jefferson Nickels | 738,000,000 | 754,080,000 | 1,492,080,000 |
| Roosevelt Dimes | 1,370,500,000 | 1,442,500,000 | 2,813,000,000 |
| Shawnee National Forest Quarter | 151,800,000 | 155,600,000 | 307,400,000 |
| Cumberland Gap National Historical Park Quarter | 223,200,000 | 215,400,000 | 438,600,000 |
| Harpers Ferry National Historical Park Quarter | 424,000,000 | 434,630,000 | 858,630,000 |
| Theodore Roosevelt National Park Quarter | 223,200,000 | 231,600,000 | 454,800,000 |
| Fort Moultrie Quarter | 62,600,000 | 73,600,000 | 136,200,000 |
| Kennedy Half Dollars | 2,100,000 | 2,100,000 | 4,200,000 |
| Native American $1 | 2,100,000 | 2,800,000 | 4,900,000 |
| Richard M. Nixon $1 | 4,340,000 | 5,460,000 | 9,800,000 |
| Gerald R. Ford $1 | 5,040,000 | 5,460,000 | 10,500,000 |
| Ronald Reagan $1 | 5,880,000 | 7,140,000 | 13,020,000 |
| Total | 7,501,160,000 | 7,819,570,000 | 15,320,730,000 |
Coin production figures in this coin news article are based on data aggregated from the Mint’s webpage at: http://www.usmint.gov/about_the_mint/?action=ProductionFigures.


