
America the Beautiful Quarters with a design emblematic of West Virginia’s Harpers Ferry National Historical Park launched last week and now appear for the first time in the U.S. Mint’s sales report.
Product options include rolls and bags of the coins produced in Philadelphia, Denver and San Francisco with mint marks of ‘P’, ‘D’ and ‘S’. The number of quarters sold during the opening seven days tally to 1,998,340 coins, the weakest sales start in the product series since the last 2014-dated design commemorating Everglades National Park in Florida. Early sales for all releases from then on include:
- 2,042,780 for 2016 Cumberland Gap quarters,
- 2,131,840 for 2016 Shawnee National Forest quarter,
- 2,323,000 for 2015 Saratoga quarters,
- 2,052,560 for 2015 Bombay Hook quarters,
- 2,179,320 for 2015 Blue Ridge Parkway quarters,
- 2,055,840 for 2015 Kisatchie National Forest quarters,
- 2,005,180 for 2015 Homestead National Monument quarters, and
- 1,918,160 for 2014 Everglades quarters.
The new quarters, as expected, were among the Mint’s best-selling collector products.
Weekly U.S. Mint Top Sellers
- 2016 Proof Set (+12,021 to 298,302)
- 2016-P&D Harpers Ferry Quarters Two-Roll Set (+6,823)
- 2016 Mint Set (+6,530 to 163,692)
- 2016-P, D & S Harpers Ferry Three-Roll Set (+6,230)
- 2016 Silver Proof Set (+5,720 to 212,722)
- 2016-S Harpers Ferry Quarters Bag (+2,602)
- 2016-S Harpers Ferry Quarters Roll (+2,555)
- 2016-D Harpers Ferry 100-Coin Bag (+1,754)
- 2016-P Harpers Ferry 100-Coin Bag (+1,671)
- 2016 Presidential $1 Coin Proof Set (+1,583 to 168,774)
The U.S. Mint published sales updates to 227 numismatic products. One hundred and fifteen of them outperformed their prior weekly sales compared to 39 previously. Five products increased by more than 1,000 units compared to 7 previously. One product had its sales reduced compared to 4 previously.
Gold Mercury Dime Sales
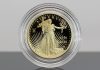
This week’s sales report also shows a seventh straight sales regression for the 2016-W Mercury Dime Centennial Gold Coin. Its latest dip is the smallest of the bunch. The now 116,111 sold is 8,889 or 7.1% lower than the 125,000 originally available. Looking back, the weekly declines include:
- 28 to 116,111 coins for the week ended June 12;
- 36 to 116,139 coins for the week ended June 5;
- 124 to 116,175 coins for the week ended May 30;
- 1,396 to 116,229 coins for the week ended May 22;
- 1,046 to 117,695 coins for the week ended May 15;
- 1,179 to 118,741 coins for the week ended May 8; and
- 2,590 to 119,920 coins for the week ended May 1.
The .9999 fine, 24-karat gold coin was available for about 40 minutes into its launch on April 21 before going off-sale. Mint officials have not announced when/how they will sell the remaining coins.
US Mint Sales: Numismatic Products
Below are tables showing the latest sales for U.S. Mint numismatic products. The sales period covers June 6 to 12. Products with an asterisk (*) are no longer available.
2016 Centennial Gold Coins |
||||
| Old Sales |
Latest Sales |
Gain/ Loss |
% Increase |
|
| 2016 Gold Mercury Dime | 116,139 | 116,111 | -28 | -0.02% |
2016 NPS Commemorative Coins |
||||
| Old Sales |
Latest Sales |
Gain/ Loss |
% Increase |
|
| $5 Gold Proof | 3,616 | 3,653 | 37 | 1.02% |
| $5 Gold Uncirculated | 2,706 | 2,732 | 26 | 0.96% |
| $1 Silver Proof | 41,562 | 42,490 | 928 | 2.23% |
| $1 Silver Uncirculated | 15,443 | 15,631 | 188 | 1.22% |
| 50c Proof Clad Half-Dollar | 28,431 | 28,898 | 467 | 1.64% |
| 50c Uncirculated Clad Half-Dollar | 14,550 | 14,721 | 171 | 1.18% |
| Three-Coin Proof Set | 11,406 | 11,520 | 114 | 1.00% |
2016 Mark Twain Commemorative Coins |
||||
| Old Sales |
Latest Sales |
Gain/ Loss |
% Increase |
|
| $5 Gold Proof | 11,808 | 11,846 | 38 | 0.32% |
| $5 Gold Uncirculated | 5,154 | 5,163 | 9 | 0.17% |
| $1 Silver Proof | 64,223 | 65,130 | 907 | 1.41% |
| $1 Silver Uncirculated | 23,008 | 23,126 | 118 | 0.51% |
2015 March of Dimes Commemorative Silver Dollars |
||||
| Old Sales |
Latest Sales |
Gain/ Loss |
% Increase |
|
| $1 Silver Proof* | 57,600 | 57,600 | – | – |
| $1 Silver Uncirculated* | 24,742 | 24,742 | – | – |
| Special Silver Set* | 74,430 | 74,430 | – | – |
2015 US Marshals Commemorative Coins |
||||
| Old Sales |
Latest Sales |
Gain/ Loss |
% Increase |
|
| $5 Gold Proof* | 9,975 | 9,975 | – | – |
| $5 Gold Uncirculated* | 6,743 | 6,743 | – | – |
| $1 Silver Proof* | 109,345 | 109,345 | – | – |
| $1 Silver Uncirculated* | 38,149 | 38,149 | – | – |
| 50c Proof* | 61,565 | 61,565 | – | – |
| 50c Uncirculated* | 30,231 | 30,231 | – | – |
| Three Coin Proof Set* | 14,984 | 14,984 | – | – |
Clad Proof Sets |
||||
| Old Sales |
Latest Sales |
Gain/ Loss |
% Increase |
|
| 2016 Proof Set | 286,281 | 298,302 | 12,021 | 4.20% |
| 2015 Proof Sets | 648,225 | 648,881 | 656 | 0.10% |
| 2014 Proof Sets* | 714,661 | 714,661 | – | – |
| 2013 Proof Sets* | 802,460 | 802,460 | – | – |
| 2016 America the Beautiful Quarters Proof Sets | 59,608 | 60,703 | 1,095 | 1.84% |
| 2015 America the Beautiful Quarters Proof Sets | 97,376 | 97,490 | 114 | 0.12% |
| 2014 America the Beautiful Quarters Proof Sets* | 115,179 | 115,179 | – | – |
| 2013 America the Beautiful Quarters Proof Sets* | 128,377 | 128,377 | – | – |
| 2015 Lyndon B. Johnson Coin & Chronicles Set* | 23,905 | 23,905 | – | – |
| 2015 John F. Kennedy Coin & Chronicles Set* | 49,051 | 49,051 | – | – |
| 2015 Eisenhower Coin & Chronicles Set* | 16,744 | 16,744 | – | – |
| 2015 Truman Coin & Chronicles Set* | 16,812 | 16,812 | – | – |
| 2014 Franklin D. Roosevelt Coin & Chronicles Set* | 19,050 | 19,050 | – | – |
| 2013 Theodore Roosevelt Coin & Chronicles Set* | 15,145 | 15,145 | – | – |
| 2016 Presidential $1 Coin Proof Sets | 167,191 | 168,774 | 1,583 | 0.95% |
| 2015 Presidential $1 Coin Proof Sets* | 222,068 | 222,068 | – | – |
| 2014 Presidential $1 Coin Proof Sets* | 229,415 | 229,415 | – | – |
| 2013 Presidential $1 Coin Proof Sets* | 266,618 | 266,618 | – | – |
| 2016 Happy Birthday Gift Sets | 10,106 | 10,545 | 439 | 4.34% |
| 2015 Happy Birthday Gift Sets* | 14,470 | 14,470 | – | – |
| 2014 Happy Birthday Gift Sets | 13,012 | 13,014 | 2 | 0.02% |
| 2013 Happy Birthday Gift Sets | 11,602 | 11,606 | 4 | 0.03% |
| 2016 Birth Gift Sets | 14,902 | 15,535 | 633 | 4.25% |
| 2015 Birth Gift Sets* | 34,548 | 34,548 | – | – |
| 2014 Birth Gift Sets | 34,164 | 34,225 | 61 | 0.18% |
| 2013 Birth Gift Sets | 41,332 | 41,384 | 52 | 0.13% |
| 2012 Birth Gift Sets* | 49,703 | 49,703 | – | – |
Silver Proof Sets |
||||
| Old Sales |
Latest Sales |
Gain/ Loss |
% Increase |
|
| 2016 Silver Proof Sets | 207,002 | 212,722 | 5,720 | 2.76% |
| 2015 Silver Proof Sets | 374,208 | 374,876 | 668 | 0.18% |
| 2014 Silver Proof Sets* | 429,493 | 429,493 | – | – |
| 2013 Silver Proof Sets* | 419,720 | 419,720 | – | – |
| 2016 America the Beautiful Quarters Silver Proof Sets | 68,674 | 69,537 | 863 | 1.26% |
| 2015 America the Beautiful Quarters Silver Proof Sets | 100,273 | 100,380 | 107 | 0.11% |
| 2014 America the Beautiful Quarters Silver Proof Sets* | 119,251 | 119,251 | – | – |
| 2013 America the Beautiful Quarters Silver Proof Sets* | 138,451 | 138,451 | – | – |
| 2013-W American Silver Eagle Two-Coin Proof Sets* | 235,689 | 235,689 | – | – |
| 2015 Congratulations Gift Sets* | 7,895 | 7,895 | – | – |
| 2014 Congratulations Gift Sets* | 7,529 | 7,529 | – | – |
| 2013 Congratulations Gift Sets* | 18,347 | 18,347 | – | – |
| 2014 Limited Edition Silver Proof Sets* | 42,614 | 42,614 | – | – |
| 2013 Limited Edition Silver Proof Sets* | 47,971 | 47,971 | – | – |
US Mint Uncirculated Sets |
||||
| Old Sales |
Latest Sales |
Gain/ Loss |
% Increase |
|
| 2015 American $1 Coin and Currency Set | 88,363 | 88,524 | 161 | 0.18% |
| 2014 American $1 Coin and Currency Set* | 50,000 | 50,000 | – | – |
| 2016 Uncirculated Mint Sets | 157,162 | 163,692 | 6,530 | 4.15% |
| 2015 Uncirculated Mint Sets | 306,703 | 307,159 | 456 | 0.15% |
| 2014 Uncirculated Mint Sets* | 345,813 | 345,813 | – | – |
| 2013 Uncirculated Mint Sets* | 376,844 | 376,844 | – | – |
| 2016 Presidential $1 Coin Uncirculated Sets | 32,640 | 33,567 | 927 | 2.84% |
| 2015 Presidential $1 Coin Uncirculated Sets | 55,728 | 55,873 | 145 | 0.26% |
| 2014 Presidential $1 Coin Uncirculated Sets | 61,561 | 61,592 | 31 | 0.05% |
| 2013 Presidential $1 Coin Uncirculated Sets* | 75,846 | 75,846 | – | – |
| 2012 Presidential $1 Coin Uncirculated Sets* | 99,743 | 99,743 | – | – |
| 2011 Presidential $1 Coin Uncirculated Sets | 84,993 | 85,015 | 22 | 0.03% |
| 2015 Annual Uncirculated Dollar Coin Sets* | 22,691 | 22,691 | – | – |
| 2014 Annual Uncirculated Dollar Coin Sets* | 28,637 | 28,637 | – | – |
| 2013 Annual Uncirculated Dollar Coin Sets* | 43,150 | 43,150 | – | – |
| 2013 Theodore Roosevelt Presidential Discovery Sets | 9,981 | 9,984 | 3 | 0.03% |
Coin Discovery Set |
||||
| Old Sales |
Latest Sales |
Gain/ Loss |
% Increase |
|
| 2014 | 7,492 | 7,499 | – | – |
Proof Silver Eagles |
||||
| Old Sales |
Latest Sales |
Gain/ Loss |
% Increase |
|
| 2015-W Proof Silver Eagles* | 699,623 | 699,623 | – | – |
| 2014-W Proof Silver Eagles* | 894,614 | 894,614 | – | – |
| 2013-W Proof Silver Eagles* | 868,494 | 868,494 | – | – |
Uncirculated Silver Eagles |
||||
| Old Sales |
Latest Sales |
Gain/ Loss |
% Increase |
|
| 2015* | 201,188 | 201,188 | – | – |
| 2014* | 224,532 | 224,532 | – | – |
| 2013* | 178,941 | 178,941 | – | – |
2016 Proof American Eagle Gold Coins |
||||
| Old Sales |
Latest Sales |
Gain/ Loss |
% Increase |
|
| 1 oz | 13,452 | 14,032 | 580 | 4.31% |
| 1/2 oz | 3,027 | 3,065 | 38 | 1.26% |
| 1/4 oz | 4,013 | 4,106 | 93 | 2.32% |
| 1/10 oz | 12,416 | 12,667 | 251 | 2.02% |
| 4-Coin Set | 10,095 | 10,147 | 52 | 0.52% |
2015 Proof American Eagle Gold Coins |
||||
| Old Sales |
Latest Sales |
Gain/ Loss |
% Increase |
|
| 1 oz* | 22,734 | 22,734 | – | – |
| 1/2 oz* | 5,903 | 5,902 | – | – |
| 1/4 oz* | 5,857 | 5,857 | – | – |
| 1/10 oz* | 16,851 | 16,851 | – | – |
| 4-Coin Set* | 9,918 | 9,918 | – | – |
Uncirculated American Eagle Gold Coins |
||||
| Old Sales |
Latest Sales |
Gain/ Loss |
% Increase |
|
| 2016 | 4,494 | 4,849 | 355 | 7.90% |
| 2015* | 6,531 | 6,533 | – | – |
| 2014* | 7,902 | 7,902 | – | – |
| 2013* | 7,293 | 7,293 | – | – |
Proof American Buffalo Gold Coins |
||||
| Old Sales |
Latest Sales |
Gain/ Loss |
% Increase |
|
| 2016 Proof Gold Buffalo | 16,308 | 16,593 | 285 | 1.75% |
| 2015 Proof Gold Buffalo* | 16,591 | 16,591 | – | – |
| 2014 Proof Gold Buffalo* | 20,557 | 20,557 | – | – |
Proof American Platinum Eagle |
||||
| Old Sales |
Latest Sales |
Gain/ Loss |
% Increase |
|
| 2015* | 3,881 | 3,881 | – | – |
| 2014* | 4,596 | 4,596 | – | – |
America the Beautiful 5 Oz Silver Coins |
||||
| Old Sales |
Latest Sales |
Gain/ Loss |
% Increase |
|
| 2016-P Cumberland Gap Silver Coins | 15,339 | 15,709 | 370 | 2.41% |
| 2016-P Shawnee Silver Coins | 17,537 | 17,642 | 105 | 0.60% |
| 2015-P Saratoga Silver Coins* | 17,563 | 17,563 | – | – |
| 2015-P Bombay Hook Silver Coins* | 17,309 | 17,309 | – | – |
| 2015-P Blue Ridge Parkway Silver Coins* | 17,461 | 17,461 | – | – |
| 2015-P Kisatchie Silver Coins* | 19,449 | 19,449 | – | – |
| 2015-P Homestead Silver Coins* | 21,283 | 21,286 | – | – |
| 2014-P Everglades Silver Coins* | 22,732 | 22,732 | – | – |
| 2014-P Great Sand Dunes Silver Coins* | 24,103 | 24,103 | – | – |
| 2014-P Arches Silver Coins* | 28,434 | 28,434 | – | – |
| 2014-P Shenandoah Silver Coins* | 28,451 | 28,451 | – | – |
| 2014-P Great Smoky Mountains Silver Coins* | 24,710 | 24,710 | – | – |
| 2013-P White Mountain Silver Coins* | 20,530 | 20,530 | – | – |
| 2013-P Perry’s Victory Silver Coins* | 17,707 | 17,707 | – | – |
| 2013-P Great Basin Silver Coins* | 17,792 | 17,792 | – | – |
| 2013-P Fort McHenry Silver Coins* | 19,802 | 19,802 | – | – |
| 2013-P Mount Rushmore Silver Coins* | 23,547 | 23,547 | – | – |
First Spouse Gold Coins |
||||
| Old Sales |
Latest Sales |
Gain/ Loss |
% Increase |
|
| Betty Ford Proof (2016) | 1,758 | 1,784 | 26 | 1.48% |
| Betty Ford Uncirculated (2016) | 1,094 | 1,107 | 13 | 1.19% |
| Pat Nixon Proof (2016) | 2,121 | 2,132 | 11 | 0.52% |
| Pat Nixon Uncirculated (2016) | 1,229 | 1,239 | 10 | 0.81% |
| Lady Bird Johnson Proof (2015) | 2,488 | 2,488 | – | – |
| Lady Bird Johnson Uncirculated (2015) | 1,619 | 1,620 | 1 | 0.06% |
| Jacqueline Kennedy Proof (2015)* | 11,222 | 11,222 | – | – |
| Jacqueline Kennedy Uncirculated (2015) | 6,103 | 6,115 | 12 | 0.20% |
| Mamie Eisenhower Proof (2015) | 2,704 | 2,704 | – | – |
| Mamie Eisenhower Uncirculated (2015) | 1,808 | 1,824 | 16 | 0.88% |
| Bess Truman Proof (2015) | 2,485 | 2,497 | 12 | 0.48% |
| Bess Truman Uncirculated (2015) | 1,732 | 1,744 | 12 | 0.69% |
| Eleanor Roosevelt Proof (2014)* | 2,377 | 2,377 | – | – |
| Eleanor Roosevelt Uncirculated (2014)* | 1,886 | 1,886 | – | – |
| Lou Hoover Proof (2014) | 2,392 | 2,392 | – | – |
| Lou Hoover Uncirculated (2014) | 1,886 | 1,886 | – | – |
| Grace Coolidge Proof (2014)* | 2,315 | 2,315 | – | – |
| Grace Coolidge Uncirculated (2014) | 1,935 | 1,937 | 2 | 0.10% |
| Florence Harding Proof (2014)* | 2,372 | 2,372 | – | – |
| Florence Harding Uncirculated (2014) | 1,905 | 1,905 | – | – |
| Edith Wilson Proof (2013)* | 2,464 | 2,464 | – | – |
| Edith Wilson Uncirculated (2013)* | 1,974 | 1,974 | – | – |
| Ellen Wilson Proof (2013)* | 2,511 | 2,511 | – | – |
| Ellen Wilson Uncirculated (2013)* | 1,980 | 1,980 | – | – |
| Helen Taft Proof (2013)* | 2,598 | 2,598 | – | – |
| Helen Taft Uncirculated (2013)* | 1,993 | 1,993 | – | – |
| Edith Roosevelt Proof (2013)* | 2,840 | 2,840 | – | – |
| Edith Roosevelt Uncirculated (2013)* | 2,027 | 2,027 | – | – |
| Ida McKinley Proof (2013)* | 2,724 | 2,724 | – | – |
| Ida McKinley Uncirculated (2013)* | 2,008 | 2,008 | – | – |
| Alice Paul Proof (2012)* | 3,505 | 3,505 | – | – |
| Alice Paul Uncirculated (2012)* | 2,798 | 2,798 | – | – |
| Frances Cleveland Proof (2012, 1st Term)* | 3,158 | 3,158 | – | – |
| Frances Cleveland Uncirculated (2012 1st Term)* | 2,454 | 2,454 | – | – |
| Caroline Harrison Proof (2012)* | 3,046 | 3,046 | – | – |
| Caroline Harrison Uncirculated (2012)* | 2,436 | 2,436 | – | – |
| Frances Cleveland Proof (2012, 2nd Term)* | 3,104 | 3,104 | – | – |
| Frances Cleveland Uncirculated (2012 2nd Term)* | 2,425 | 2,425 | – | – |
Presidential $1 Four-Coin Set |
||||
| Old Sales |
Latest Sales |
Gain/ Loss |
% Increase |
|
| 2015-P | 10,862 | 10,882 | 20 | 0.18% |
| 2015-D | 9,332 | 9,341 | 9 | 0.10% |
| 2014-P | 12,781 | 12,788 | 7 | 0.05% |
| 2014-D | 9,323 | 9,331 | 8 | 0.09% |
| 2013-P* | 17,771 | 17,771 | – | – |
| 2013-D | 14,923 | 14,923 | – | – |
Presidential Coins & First Spouse Medal Sets |
||||
| Old Sales |
Latest Sales |
Gain/ Loss |
% Increase |
|
| Ford | 3,783 | 3,920 | 137 | 3.62% |
| Nixon | 4,874 | 4,874 | – | – |
| Johnson | 6,976 | 6,991 | 15 | 0.22% |
| Kennedy* | 24,183 | 24,183 | – | – |
| Eisenhower | 8,485 | 8,497 | 12 | 0.14% |
| Truman | 7,699 | 7,707 | 8 | 0.10% |
| Roosevelt* | 7,000 | 7,000 | – | – |
| Hoover* | 4,500 | 4,500 | – | – |
| Coolidge* | 4,500 | 4,500 | – | – |
| Harding* | 4,500 | 4,500 | – | – |
| Edith Wilson | 3,979 | 3,979 | – | – |
| Ellen Wilson | 3,998 | 3,998 | – | – |
| Helen Taft | 3,994 | 3,994 | – | – |
| Edith Roosevelt | 5,002 | 5,002 | – | – |
| Ida McKinley | 3,994 | 3,994 | – | – |
| Abigail Fillmore | 11,031 | 11,033 | 2 | 0.02% |
| Jane Pierce | 8,818 | 8,821 | 3 | 0.03% |
| Buchanan’s Liberty | 8,823 | 8,826 | 3 | 0.03% |
| Mary Todd Lincoln* | 15,858 | 15,858 | – | – |
| Eliza Johnson | 7,152 | 7,154 | 2 | 0.03% |
| Julia Grant | 7,858 | 7,861 | 3 | 0.04% |
| Lucy Hayes | 6,187 | 6,190 | 3 | 0.05% |
| Lucretia Garfield | 5,956 | 5,958 | 2 | 0.03% |
| Alice Paul | 5,846 | 5,851 | 5 | 0.09% |
| Frances Cleveland (1st) | 5,302 | 5,307 | 5 | 0.09% |
| Caroline Harrison | 5,227 | 5,234 | 7 | 0.13% |
| Frances Cleveland (2nd) | 5,086 | 5,092 | 6 | 0.12% |
Presidential $1 Coin Covers |
||||
| Old Sales |
Latest Sales |
Gain/ Loss |
% Increase |
|
| Gerald R. Ford | 10,867 | 11,026 | 159 | 1.46% |
| Richard M. Nixon | 12,326 | 12,419 | 93 | 0.75% |
| Lyndon B. Johnson | 12,592 | 12,617 | 25 | 0.20% |
| John F. Kennedy | 21,707 | 21,750 | 43 | 0.20% |
| Dwight D. Eisenhower* | 14,823 | 14,823 | – | – |
| Harry S. Truman | 14,788 | 14,788 | – | – |
| Franklin Roosevelt | 14,625 | 14,629 | 4 | 0.03% |
| Herbert Hoover | 12,229 | 12,233 | 4 | 0.03% |
| Calvin Coolidge | 12,750 | 12,755 | 5 | 0.04% |
| Warren G. Harding | 12,921 | 12,925 | 4 | 0.03% |
| William Henry Harrison | 30,837 | 30,837 | – | – |
| John Tyler | 27,470 | 27,470 | – | – |
| James K. Polk | 25,703 | 25,703 | – | – |
| Zachary Taylor | 24,669 | 24,669 | – | – |
| Millard Fillmore | 23,722 | 23,724 | 2 | 0.01% |
| Franklin Pierce | 22,184 | 22,185 | 1 | 0.00% |
| James Buchanan | 20,912 | 20,913 | 1 | 0.00% |
| Abraham Lincoln* | 36,783 | 36,783 | – | – |
| Andrew Johnson | 19,376 | 19,377 | 1 | 0.01% |
| Ulysses S. Grant | 20,055 | 20,069 | 14 | 0.07% |
| Rutherford B. Hayes | 17,584 | 17,586 | 2 | 0.01% |
| James Garfield | 16,805 | 16,805 | – | – |
| Chester Arthur | 16,945 | 16,947 | 2 | 0.01% |
| Grover Cleveland (1st) | 15,445 | 15,446 | 1 | 0.01% |
| Benjamin Harrison | 15,013 | 15,016 | 3 | 0.02% |
| Grover Cleveland (2nd) | 14,285 | 14,287 | 2 | 0.01% |
| William McKinley | 14,572 | 14,576 | 4 | 0.03% |
| Theodore Roosevelt | 16,898 | 16,901 | 3 | 0.02% |
| William Howard Taft | 13,472 | 13,474 | 2 | 0.01% |
| Woodrow Wilson | 13,086 | 13,089 | 3 | 0.02% |
2016 Gerald R. Ford $1 Coin Rolls, Bags, Boxes |
||||
| Old Sales |
Latest Sales |
Gain/ Loss |
% Increase |
|
| 25-coin roll set (P) | 37,663 | 37,995 | 332 | 0.88% |
| 25-coin roll set (D) | 34,191 | 34,479 | 288 | 0.84% |
| 100-coin bag (P) | 915 | 927 | 12 | 1.31% |
| 100-coin bag (D) | 830 | 841 | 11 | 1.33% |
| 250-coin box (P) | 3,536 | 3,567 | 31 | 0.88% |
| 250-coin box (D) | 3,234 | 3,277 | 43 | 1.33% |
2016 Richard M. Nixon $1 Coin Rolls, Bags, Boxes |
||||
| Old Sales |
Latest Sales |
Gain/ Loss |
% Increase |
|
| 25-coin roll set (P) | 40,643 | 40,860 | 217 | 0.53% |
| 25-coin roll set (D) | 35,465 | 35,636 | 171 | 0.48% |
| 100-coin bag (P) | 1,039 | 1,049 | 10 | 0.96% |
| 100-coin bag (D) | 1,027 | 1,031 | 4 | 0.39% |
| 250-coin box (P) | 4,099 | 4,118 | 19 | 0.46% |
| 250-coin box (D) | 3,814 | 3,833 | 19 | 0.50% |
2015 Lyndon B. Johnson $1 Coin Rolls, Bags, Boxes |
||||
| Old Sales |
Latest Sales |
Gain/ Loss |
% Increase |
|
| 25-coin roll set (P)* | 40,000 | 40,000 | – | – |
| 25-coin roll set (D)* | 37,742 | 37,742 | – | – |
| 100-coin bag (P) | 1,266 | 1,269 | 3 | 0.24% |
| 100-coin bag (D) | 1,283 | 1,286 | 3 | 0.23% |
| 250-coin box (P) | 4,631 | 4,642 | 11 | 0.24% |
| 250-coin box (D) | 5,707 | 5,729 | 22 | 0.39% |
2015 John F. Kennedy $1 Coin Rolls, Bags, Boxes |
||||
| Old Sales |
Latest Sales |
Gain/ Loss |
% Increase |
|
| 25-coin roll set (P) | 50,333 | 50,393 | 60 | 0.12% |
| 25-coin roll set (D) | 45,520 | 45,564 | 44 | 0.10% |
| 100-coin bag (P) | 2,222 | 2,233 | 11 | 0.50% |
| 100-coin bag (D) | 1,983 | 1,992 | 9 | 0.45% |
| 250-coin box (P) | 7,290 | 7,309 | 19 | 0.26% |
| 250-coin box (D) | 6,653 | 6,679 | 26 | 0.39% |
2015 Dwight D. Eisenhower $1 Coin Rolls, Bags, Boxes |
||||
| Old Sales |
Latest Sales |
Gain/ Loss |
% Increase |
|
| 25-coin roll set (P)* | 39,729 | 39,729 | – | – |
| 25-coin roll set (D)* | 37,728 | 37,728 | – | – |
| 100-coin bag (P) | 1,895 | 1,906 | 11 | 0.58% |
| 100-coin bag (D) | 1,825 | 1,836 | 11 | 0.60% |
| 250-coin box (P) | 7,577 | 7,591 | 14 | 0.18% |
| 250-coin box (D) | 5,728 | 5,741 | 13 | 0.23% |
2015 Harry S. Truman $1 Coin Rolls, Bags, Boxes |
||||
| Old Sales |
Latest Sales |
Gain/ Loss |
% Increase |
|
| 25-coin roll set (P)* | 39,686 | 39,686 | – | – |
| 25-coin roll set (D)* | 37,655 | 37,655 | – | – |
| 100-coin bag (P)* | 3,477 | 3,477 | – | – |
| 100-coin bag (D)* | 3,334 | 3,334 | – | – |
| 250-coin box (P) | 7,903 | 7,910 | 7 | 0.09% |
| 250-coin box (D) | 5,865 | 5,878 | 13 | 0.22% |
2014 Franklin Roosevelt $1 Coin Rolls, Bags, Boxes |
||||
| Old Sales |
Latest Sales |
Gain/ Loss |
% Increase |
|
| 25-coin roll set (P) | 56,162 | 56,193 | 31 | 0.06% |
| 25-coin roll set (D) | 51,446 | 51,474 | 28 | 0.05% |
| 100-coin bag (P)* | 1,986 | 1,986 | – | – |
| 100-coin bag (D)* | 1,968 | 1,968 | – | – |
| 250-coin box (P)* | 6,977 | 6,977 | – | – |
| 250-coin box (D)* | 5,025 | 5,025 | – | – |
2014 Herbert Hoover $1 Coin Rolls, Bags, Boxes |
||||
| Old Sales |
Latest Sales |
Gain/ Loss |
% Increase |
|
| 25-coin roll set (P) | 52,139 | 52,169 | 30 | 0.06% |
| 25-coin roll set (D) | 45,230 | 45,248 | 18 | 0.04% |
| 100-coin bag (P)* | 1,978 | 1,978 | – | – |
| 100-coin bag (D)* | 1,990 | 1,990 | – | – |
| 250-coin box (P) | 6,994 | 6,994 | – | – |
| 250-coin box (D)* | 5,050 | 5,050 | – | – |
Native American Dollar Rolls |
||||
| Old Sales |
Latest Sales |
Gain/ Loss |
% Increase |
|
| 2016-dated 25-coin roll set (P) | 13,869 | 13,963 | 94 | 0.68% |
| 2016-dated 25-coin roll set (D) | 13,676 | 13,789 | 113 | 0.83% |
| 2016-dated 100-coin bag (P) | 808 | 818 | 10 | 1.24% |
| 2016-dated 100-coin bag (D) | 872 | 883 | 11 | 1.26% |
| 2016-dated 250-coin box (P) | 1,270 | 1,290 | 20 | 1.57% |
| 2016-dated 250-coin box (D) | 1,344 | 1,360 | 16 | 1.19% |
| 2015-dated 25-coin roll set (P) | 16,992 | 17,014 | 22 | 0.13% |
| 2015-dated 25-coin roll set (D) | 17,415 | 17,435 | 20 | 0.11% |
| 2015-dated 100-coin bag (P) | 1,828 | 1,828 | – | – |
| 2015-dated 100-coin bag (D) | 1,914 | 1,917 | 3 | 0.16% |
| 2015-dated 250-coin box (P) | 2,080 | 2,083 | 3 | 0.14% |
| 2015-dated 250-coin box (D) | 2,013 | 2,022 | 9 | 0.45% |
| 2014-dated 25-coin roll set (P)* | 19,173 | 19,173 | – | – |
| 2014-dated 25-coin roll set (D)* | 19,113 | 19,113 | – | – |
| 2014-dated 100-coin bag (P)* | 1,987 | 1,987 | – | – |
| 2014-dated 100-coin bag (D)* | 1,990 | 1,990 | – | – |
| 2014-dated 250-coin box (P)* | 2,611 | 2,611 | – | – |
| 2014-dated 250-coin box (D)* | 2,480 | 2,480 | – | – |
| 2013-dated 25-coin roll set (P)* | 24,914 | 24,914 | – | – |
| 2013-dated 25-coin roll set (D)* | 23,864 | 23,864 | – | – |
| 2013-dated 100-coin bag (P)* | 1,481 | 1,481 | – | – |
| 2013-dated 100-coin bag (D)* | 1,478 | 1,478 | – | – |
| 2013-dated 250-coin box (P)* | 2,508 | 2,508 | – | – |
| 2013-dated 250-coin box (D)* | 2,496 | 2,496 | – | – |
| 2013-dated 500-coin box (P)* | 498 | 498 | – | – |
| 2013-dated 500-coin box (D)* | 494 | 494 | – | – |
Kennedy Half Dollar Rolls |
||||
| Old Sales |
Latest Sales |
Gain/ Loss |
% Increase |
|
| 2016-dated 200-coin bag (P&D) | 4,807 | 4,994 | 187 | 3.89% |
| 2016-dated 2-roll set (P&D) | 16,127 | 16,339 | 212 | 1.31% |
| 2015-dated 200-coin bag (P&D) | 12,453 | 12,490 | 37 | 0.30% |
| 2015-dated 2-roll set (P&D) | 26,456 | 26,511 | 55 | 0.21% |
| 2014-dated 200-coin bag (P&D)* | 12,967 | 12,967 | – | – |
| 2014-dated 2-roll set (P&D)* | 30,331 | 30,331 | – | – |
| 2013-dated 200-coin bag (P&D)* | 9,980 | 9,980 | – | – |
| 2013-dated 2-roll set (P&D)* | 24,918 | 24,918 | – | – |
| 2012-dated 200-coin bag (P&D)* | 10,323 | 10,323 | – | – |
| 2012-dated 2-roll set (P&D)* | 33,766 | 33,766 | – | – |
America the Beautiful Quarters Uncirculated Coin Set |
||||
| Old Sales |
Latest Sales |
Gain/ Loss |
% Increase |
|
| 2016 Issue | 19,106 | 19,930 | 824 | 4.31% |
| 2015 Issue | 26,189 | 26,299 | 110 | 0.42% |
| 2014 Issue | 29,064 | 29,089 | 25 | 0.09% |
| 2013 Issue | 42,030 | 42,045 | 15 | 0.04% |
| 2012 Issue* | 42,223 | 42,223 | – | – |
| 2011 Issue | 39,853 | 39,863 | 10 | 0.03% |
| 2010 Issue | 41,139 | 41,151 | 12 | 0.03% |
America the Beautiful Quarters Circulating Coin Set |
||||
| Old Sales |
Latest Sales |
Gain/ Loss |
% Increase |
|
| 2015 Issue | 18,933 | 18,972 | 39 | 0.21% |
| 2014 Issue | 22,322 | 22,431 | 109 | 0.49% |
| 2013 Issue | 28,009 | 28,016 | 7 | 0.02% |
| 2012 Issue* | 24,869 | 24,869 | – | – |
| 2011 Issue | 35,301 | 35,312 | 11 | 0.03% |
| 2010 Issue | 38,790 | 38,808 | 18 | 0.05% |
America the Beautiful Quarters Three-Coin Sets |
||||
| Old Sales |
Latest Sales |
Gain/ Loss |
% Increase |
|
| Cumberland Gap | 10,390 | 10,670 | 280 | 2.69% |
| Shawnee | 12,256 | 12,387 | 131 | 1.07% |
| Saratoga | 14,104 | 14,118 | 14 | 0.10% |
| Bombay Hook | 12,759 | 12,767 | 8 | 0.06% |
| Blue Ridge Parkway | 16,261 | 16,275 | 14 | 0.09% |
| Kisatchie Set | 14,558 | 14,567 | 9 | 0.06% |
| Homestead Set | 15,548 | 15,558 | 10 | 0.06% |
| Everglades Set | 13,825 | 13,829 | 4 | 0.03% |
| Great Sand Dunes Set | 13,610 | 13,611 | 1 | 0.01% |
| Arches Three-Coin Set | 15,189 | 15,192 | 3 | 0.02% |
| Shenandoah Three-Coin Set | 16,794 | 16,806 | 12 | 0.07% |
| Great Smoky Mountains Set | 18,588 | 18,588 | – | – |
| Mount Rushmore Quarters Set | 16,987 | 16,997 | 10 | 0.06% |
| Fort McHenry Quarters Set | 15,738 | 15,743 | 5 | 0.03% |
| Great Basin Quarters Set | 15,080 | 15,083 | 3 | 0.02% |
| Perry’s Victory Quarters Set | 17,195 | 17,197 | 2 | 0.01% |
| White Mountain Quarters Set | 18,056 | 18,056 | – | – |
| Denali Quarters Set | 17,343 | 17,351 | 8 | 0.05% |
| Hawaii Volcanoes Quarters Set* | 16,508 | 16,647 | – | – |
| Acadia Quarters Set | 19,778 | 19,788 | 10 | 0.05% |
| Chaco Culture Quarters Set | 19,211 | 19,221 | 10 | 0.05% |
| El Yunque Quarters Set* | 19,891 | 19,891 | – | – |
| Chickasaw Quarters Set | 15,821 | 15,827 | 6 | 0.04% |
| Vicksburg Quarters Set | 17,658 | 17,663 | 5 | 0.03% |
| Olympic Quarters Set | 17,275 | 17,280 | 5 | 0.03% |
| Glacier Quarters Set | 18,479 | 18,484 | 5 | 0.03% |
| Gettysburg Quarters Set | 22,154 | 22,162 | 8 | 0.04% |
| Mount Hood Quarters Set | 17,971 | 17,972 | 1 | 0.01% |
| Grand Canyon Quarters Set | 21,401 | 21,409 | 8 | 0.04% |
| Yosemite Quarters Set | 21,482 | 21,484 | 2 | 0.01% |
| Yellowstone Quarters Set | 24,262 | 24,266 | 4 | 0.02% |
| Hot Springs Quarters Set | 22,796 | 22,798 | 2 | 0.01% |
2016 Harpers Ferry Quarters |
||||
| Old Sales |
Latest Sales |
Gain/ Loss |
% Increase |
|
| 100-Coin Bag (S) | – | 2,602 | – | – |
| 40-Coin Roll (S) | – | 2,555 | – | – |
| Three-Roll Set | – | 6,230 | – | – |
| 100-Coin Bag (P) | – | 1,671 | – | – |
| 100-Coin Bag (D) | – | 1,754 | – | – |
| Two-Roll Set | – | 6,823 | – | – |
2016 Cumberland Gap Quarters |
||||
| Old Sales |
Latest Sales |
Gain/ Loss |
% Increase |
|
| 100-Coin Bag (S) | 3,468 | 3,518 | 50 | 1.44% |
| 40-Coin Roll (S) | 3,401 | 3,457 | 56 | 1.65% |
| Three-Roll Set | 7,866 | 7,987 | 121 | 1.54% |
| 100-Coin Bag (P) | 1,992 | 2,017 | 25 | 1.26% |
| 100-Coin Bag (D) | 1,846 | 2,000 | 154 | 8.34% |
| Two-Roll Set | 6,837 | 6,886 | 49 | 0.72% |
2016 Shawnee Quarters |
||||
| Old Sales |
Latest Sales |
Gain/ Loss |
% Increase |
|
| 100-Coin Bag (S) | 4,115 | 4,131 | 16 | 0.39% |
| 40-Coin Roll (S) | 3,825 | 3,845 | 20 | 0.52% |
| Three-Roll Set | 8,872 | 8,926 | 54 | 0.61% |
| 100-Coin Bag (P) | 2,062 | 2,073 | 11 | 0.53% |
| 100-Coin Bag (D) | 2,022 | 2,033 | 11 | 0.54% |
| Two-Roll Set | 7,225 | 7,246 | 21 | 0.29% |
2015 Saratoga Quarters |
||||
| Old Sales |
Latest Sales |
Gain/ Loss |
% Increase |
|
| 100-Coin Bag (S) | 4,638 | 4,646 | 8 | 0.17% |
| 40-Coin Roll (S) | 4,363 | 4,373 | 10 | 0.23% |
| Three-Roll Set | 9,241 | 9,249 | 8 | 0.09% |
| 100-Coin Bag (P) | 2,224 | 2,227 | 3 | 0.13% |
| 100-Coin Bag (D) | 2,172 | 2,176 | 4 | 0.18% |
| Two-Roll Set | 7,456 | 7,461 | 5 | 0.07% |
2015 Bombay Hook Quarters |
||||
| Old Sales |
Latest Sales |
Gain/ Loss |
% Increase |
|
| 100-Coin Bag (S) | 4,560 | 4,566 | 6 | 0.13% |
| 40-Coin Roll (S) | 4,316 | 4,323 | 7 | 0.16% |
| Three-Roll Set | 9,224 | 9,231 | 7 | 0.08% |
| 100-Coin Bag (P) | 2,181 | 2,186 | 5 | 0.23% |
| 100-Coin Bag (D) | 2,174 | 2,186 | 12 | 0.55% |
| Two-Roll Set | 7,584 | 7,587 | 3 | 0.04% |
2015 Blue Ridge Parkway Quarters |
||||
| Old Sales |
Latest Sales |
Gain/ Loss |
% Increase |
|
| 100-Coin Bag (S) | 4,946 | 4,954 | 8 | 0.16% |
| 40-Coin Roll (S) | 4,959 | 4,967 | 8 | 0.16% |
| Three-Roll Set | 9,964 | 9,971 | 7 | 0.07% |
| 100-Coin Bag (P) | 2,332 | 2,334 | 2 | 0.09% |
| 100-Coin Bag (D) | 2,322 | 2,325 | 3 | 0.13% |
| Two-Roll Set | 7,895 | 7,896 | 1 | 0.01% |
2015 Kisatchie Quarters |
||||
| Old Sales |
Latest Sales |
Gain/ Loss |
% Increase |
|
| 100-Coin Bag (S)* | 5,144 | 5,149 | – | – |
| 40-Coin Roll (S)* | 4,800 | 4,801 | – | – |
| Three-Roll Set* | 9,805 | 9,811 | – | – |
| 100-Coin Bag (P)* | 2,382 | 2,383 | – | – |
| 100-Coin Bag (D)* | 2,344 | 2,344 | – | – |
| Two-Roll Set* | 7,963 | 7,967 | – | – |
2015 Homestead Quarters |
||||
| Old Sales |
Latest Sales |
Gain/ Loss |
% Increase |
|
| 100-Coin Bag (S)* | 5,484 | 5,490 | – | – |
| 40-Coin Roll (S)* | 4,483 | 4,483 | – | – |
| Three-Roll Set* | 10,631 | 10,638 | – | – |
| 100-Coin Bag (P)* | 2,824 | 2,824 | – | – |
| 100-Coin Bag (D)* | 2,490 | 2,490 | – | – |
| Two-Roll Set* | 8,536 | 8,537 | – | – |
Visit the United States Mint website at http://catalog.usmint.gov for product information.