Early United States Mint sales figures are now available for the glow-in-the dark 2019 Rocketship set for young collectors and the 2019 Proof Set with accompanied "W" cent. Both products led weekly sales.
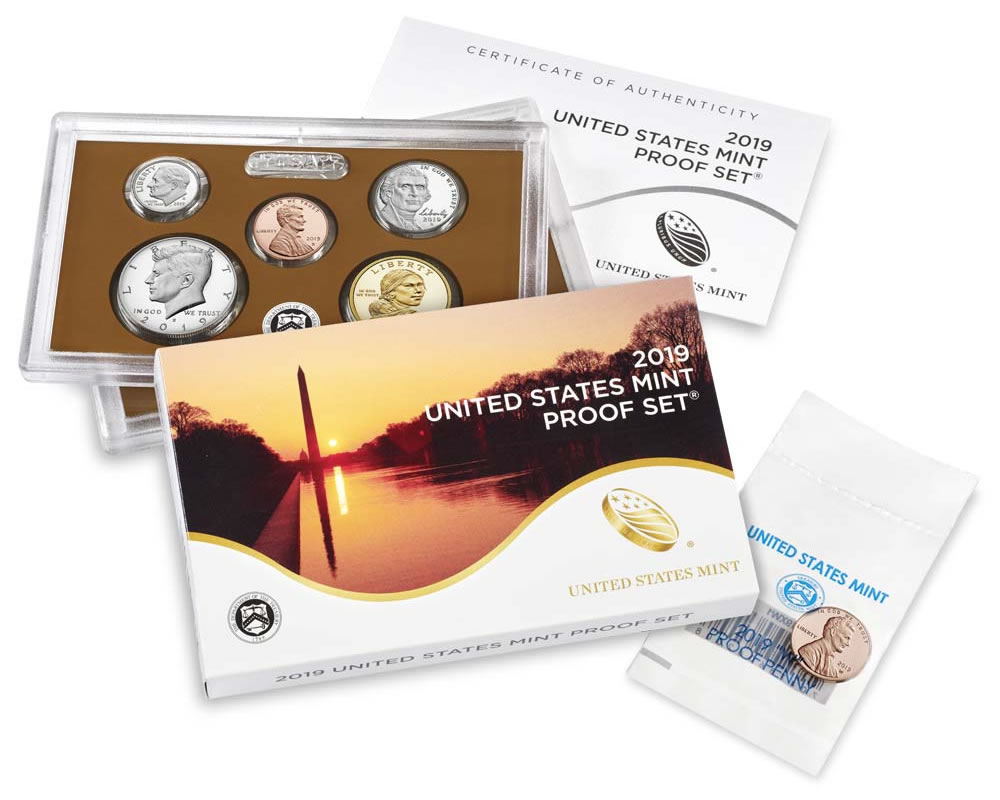
Despite having fewer days in its first reported sales total, the annually issued Proof Set scored three-day sales of 196,034 for the best start since the one from 2015. A bonus Lincoln cent with the "W" mint mark of the West Point Mint comes with every set. It’s boosting sales. This bodes well for the upcoming 2019 Silver Proof Set and 2019 Uncirculated Mint Set as their orders will include their own unique "W" cent.
Proof Sets over the years have launched in different months and on different days of the week — usually on Mondays, Tuesdays or Thursdays, affecting their first-reported totals. Keep that in mind when looking at the figures in the table below.
2007 – 2019 US Mint Proof Set Sales
| Issue Price | Coins | Issue Date | Debut Sales Date | Debut Sales | Ending Sales | |
| 2019 Proof Set | $27.95 | 10 | March 1, 2019 | March 3, 2019 | 196,034 | – |
| 2018 Proof Set | $27.95 | 10 | March 6, 2018 | March 11, 2018 | 182,940 | 497,294* |
| 2017 Proof Set | $26.95 | 10 | March 29, 2017 | April 2, 2017 | 194,989 | 568,678 |
| 2016 Proof Set | $31.95 | 13 | April 1, 2016 | April 4, 2016 | 185,624 | 595,184 |
| 2015 Proof Set | $32.95 | 14 | March 24, 2015 | March 29, 2015 | 232,107 | 662,854 |
| 2014 Proof Set | $31.95 | 14 | March 25, 2014 | March 30, 2014 | 214,241 | 714,661 |
| 2013 Proof Set | $31.95 | 14 | March 28, 2013 | April 1, 2013 | 205,740 | 802,460 |
| 2012 Proof Set | $31.95 | 14 | May 7, 2012 | May 14, 2012 | 243,494 | 794,002 |
| 2011 Proof Set | $31.95 | 14 | January 11, 2011 | January 16, 2011 | 253,144 | 1,098,835 |
| 2010 Proof Set | $31.95 | 14 | July 22, 2010 | July 25, 2010 | 296,379 | 1,103,950 |
| 2009 Proof Set | $29.95 | 18 | June 1, 2009 | June 7, 2009 | 437,178 | 1,477,967 |
| 2008 Proof Set | $26.95 | 14 | June 24, 2008 | July 6, 2008 | 424,402 | 1,405,674 |
| 2007 Proof Set | $26.95 | 14 | July 19, 2007 | July 22, 2007 | 386,476 | 1,702,116 |
*The 2018 Proof Set is still available, advancing in sales by 1,367 from a week ago.
Debut of 2019 Rocketship
The Rocketship product launched with a solid start, logging four-day sales of 17,825 units.
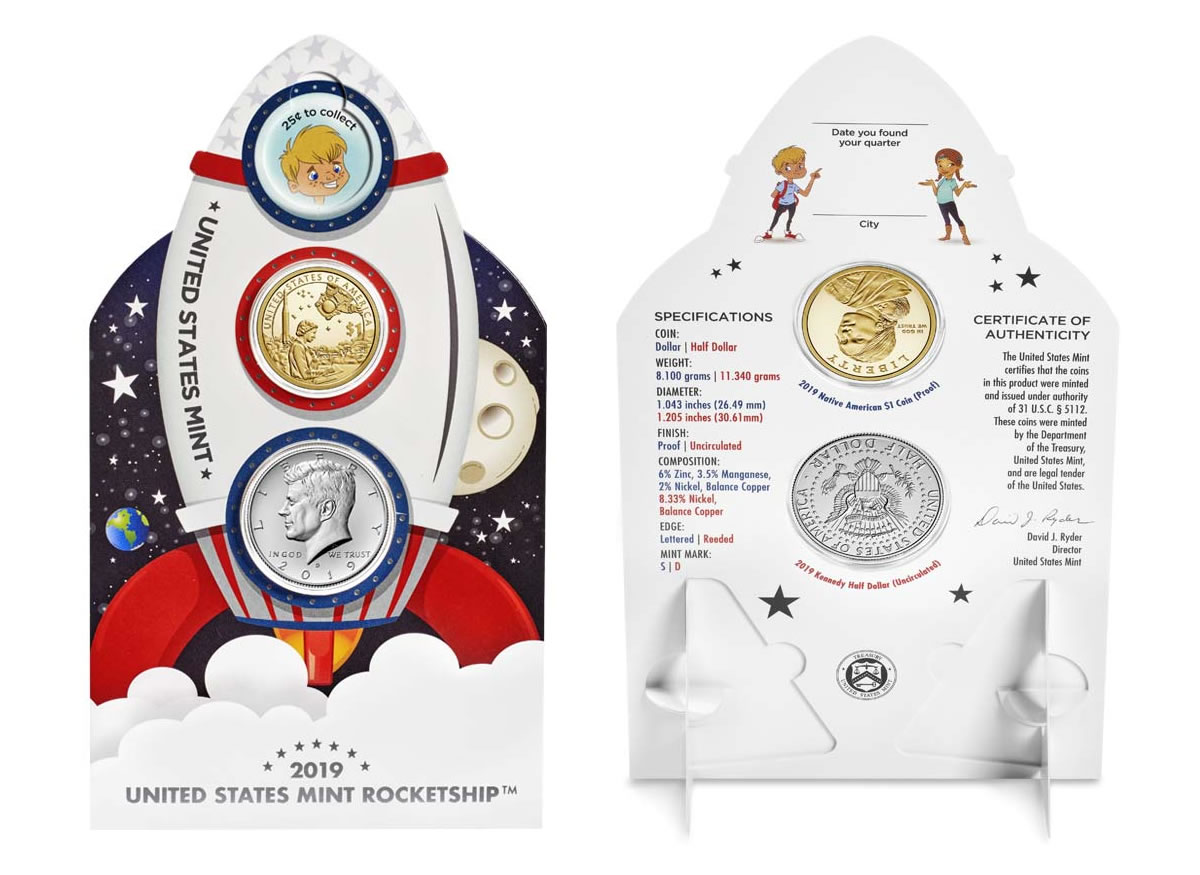
The only slightly comparable product to the 2019 Rocketship set is the still available Coin Discovery Set from 2014. It opened with four-day sales of 3,025 units and now stands at 11,449.
Weekly U.S. Mint Top Sellers
Here’s a listing of the U.S. Mint’s most popular products for the week ended March 3:
- 2019 Proof Set (+196,034)
- 2019 Rocketship (+17,825)
- 2019-W Proof Silver Eagle (+5,877 to 242,086)
- 2019 America the Beautiful Quarters Silver Proof Set (+5,235 to 49,159)
- 2019-P Proof Apollo 11 Silver Dollar (+4,793 to 142,780)
- 2018-W Uncirculated Silver Eagle (+3,509 to 137,306)
- 2018-S Proof American Innovation Dollar (+2,800 to 168,062)
- 2019-S Proof Apollo 11 Half Dollar (+1,825 to 47,537)
- 2019 America the Beautiful Quarters Proof Set (+1,641 to 44,404)
- 2019-P Uncirculated Apollo 11 Silver Dollar (+1,408 to 48,533)
In its latest report, the U.S. Mint published sales data for 115 numismatic products. Twenty-three products outperformed their prior weekly gains against 64 previously. Not counting the new products so as to compare apples to apples, 9 products increased by more than 1,000 units against 11 in the previous report.
In addition, 2 products saw their sales reduced compared to 3 previously. The sold out 2019-S Proof Apollo 11 Half Dollar Set fell by 104 units to 98,912.
US Mint Sales: Numismatic Products
Below are tables showing the latest sales for U.S. Mint numismatic products. The sales period covers from Feb. 25 to March 3. Products with an asterisk (*) are no longer available or had no reported sales.
American Liberty / 225th Anniversary Products |
||||
| Old Sales |
Latest Sales |
Gain/ Loss |
% Increase |
|
| 2018-W $10 American Liberty Gold Coin | 27,359 | 27,479 | 120 | 0.44% |
| 2017 American Liberty Silver Four-Medal Set* | 32,647 | 32,647 | – | – |
| 2017-S Enhanced Uncirculated Coin Set* | 210,419 | 210,419 | – | – |
| 2017-W $100 American Liberty Gold Coin | 30,118 | 30,153 | 35 | 0.12% |
| 2017-P Proof American Liberty Silver Medal* | 55,187 | 55,187 | – | – |
2019 Apollo 11 Commemorative Coins |
||||
| Old Sales |
Latest Sales |
Gain/ Loss |
% Increase |
|
| 2019-W Proof $5 Apollo 11 Gold Coin | 24,160 | 24,617 | 457 | 1.89% |
| 2019-W Uncirculated $5 Apollo 11 Gold Coin | 10,326 | 10,450 | 124 | 1.20% |
| 2019-P Proof Apollo 11 Silver Dollar | 137,987 | 142,780 | 4,793 | 3.47% |
| 2019-P Uncirculated Apollo 11 Silver Dollar | 47,125 | 48,533 | 1,408 | 2.99% |
| 2019-S Proof Apollo 11 Half Dollar | 45,712 | 47,537 | 1,825 | 3.99% |
| 2019-D Uncirculated Apollo 11 Half Dollar | 31,313 | 32,107 | 794 | 2.54% |
| 2019-S Proof Apollo 11 Half Dollar Set | 99,016 | 98,912 | -104 | -0.11% |
| 2019-P Proof Apollo 11 Five Ounce Silver Coin | 63,428 | 63,534 | 106 | 0.17% |
2018 Breast Cancer Awareness Commemorative Coins |
||||
| Old Sales |
Latest Sales |
Gain/ Loss |
% Increase |
|
| 2018 Breast Cancer Awareness Coin and Stamp Set* | 4,455 | 4,455 | – | – |
| 2018-W Proof $5 Breast Cancer Awareness Gold Coin* | 10,386 | 10,386 | – | – |
| 2018-W Uncirculated $5 Breast Cancer Awareness Gold Coin* | 4,477 | 4,477 | – | – |
| 2018-P Proof Breast Cancer Awareness Silver Dollar* | 34,542 | 34,542 | – | – |
| 2018-P Uncirculated Breast Cancer Awareness Silver Dollar* | 12,526 | 12,526 | – | – |
| 2018-S Proof Breast Cancer Awareness Clad Half Dollar* | 17,937 | 17,937 | – | – |
| 2018-D Uncirculated Breast Cancer Awareness Clad Half Dollar* | 11,301 | 11,301 | – | – |
2018 WWI Centennial Silver Dollar and Medal Commemoratives |
||||
| Old Sales |
Latest Sales |
Gain/ Loss |
% Increase |
|
| 2018 Proof WWI Silver Dollar* | 64,982 | 64,982 | – | – |
| 2018 Uncirculated WWI Silver Dollar* | 22,336 | 22,336 | – | – |
| 2018 WWI Silver Dollar and Army Silver Medal Set* | 15,621 | 15,621 | – | – |
| 2018 WWI Silver Dollar and Navy Silver Medal Set* | 12,253 | 12,253 | – | – |
| 2018 WWI Silver Dollar and Marines Silver Medal Set* | 12,648 | 12,648 | – | – |
| 2018 WWI Silver Dollar Coast Guard Silver Medal Set* | 9,813 | 9,813 | – | – |
| 2018 WWI Silver Dollar Air Service Silver Medal Set* | 12,520 | 12,520 | – | – |
Clad Proof Set |
||||
| Old Sales |
Latest Sales |
Gain/ Loss |
% Increase |
|
| 2019 Proof Set | – | 196,034 | – | – |
| 2018 Proof Set | 495,927 | 497,294 | 1,367 | 0.28% |
| 2017 Proof Set* | 568,678 | 568,678 | – | – |
| 2016 Proof Set* | 595,184 | 595,184 | – | – |
| 2019 America the Beautiful Quarters Proof Set | 42,763 | 44,404 | 1,641 | 3.84% |
| 2018 America the Beautiful Quarters Proof Set | 84,399 | 84,552 | 153 | 0.18% |
| 2017 America the Beautiful Quarters Proof Set* | 88,909 | 88,909 | – | – |
| 2016 America the Beautiful Quarters Proof Set* | 91,674 | 91,674 | – | – |
| 2016 Ronald Reagan Coin & Chronicles Set* | 47,447 | 47,447 | – | – |
| 2016 Presidential $1 Coin Proof Set* | 231,549 | 231,549 | – | – |
| 2019 Happy Birthday Gift Set | 7,751 | 8,327 | 576 | 7.43% |
| 2018 Happy Birthday Gift Set | 17,620 | 17,618 | -2 | -0.01% |
| 2019 Birth Gift Set | 6,779 | 7,349 | 570 | 8.41% |
| 2018 Birth Gift Set | 28,386 | 28,567 | 181 | 0.64% |
Silver Proof Set |
||||
| Old Sales |
Latest Sales |
Gain/ Loss |
% Increase |
|
| 2018 Silver Proof Set | 314,849 | 315,807 | 958 | 0.30% |
| 2017 Silver Proof Set* | 358,085 | 358,085 | – | – |
| 2018 Silver Reverse Proof Set* | 199,116 | 199,116 | – | – |
| 2019 America the Beautiful Quarters Silver Proof Set | 43,924 | 49,159 | 5,235 | 11.92% |
| 2018 America the Beautiful Quarters Silver Proof Set | 76,535 | 76,686 | 151 | 0.20% |
| 2017 America the Beautiful Quarters Silver Proof Set* | 89,632 | 89,632 | – | – |
| 2019 Congratulations Gift Set | 21,887 | 22,046 | 159 | 0.73% |
| 2018 Congratulations Gift Set* | 19,267 | 19,267 | – | – |
| 2017 Congratulations Gift Set* | 74,898 | 74,898 | – | – |
| 2018 Limited Edition Silver Proof Set | 43,640 | 43,927 | 287 | 0.66% |
| 2017 Limited Edition Silver Proof Set* | 48,901 | 48,901 | – | – |
US Mint Uncirculated Sets |
||||
| Old Sales |
Latest Sales |
Gain/ Loss |
% Increase |
|
| 2016 American $1 Coin and Currency Set* | 50,737 | 50,737 | – | – |
| 2018 Uncirculated Mint Set | 243,872 | 244,427 | 555 | 0.23% |
| 2017 Uncirculated Mint Set* | 286,813 | 286,813 | – | – |
Kids Coin Sets |
||||
| Old Sales |
Latest Sales |
Gain/ Loss |
% Increase |
|
| 2019 Rocketship | – | 17,825 | – | – |
| 2014 Coin Discovery Set | 11,367 | 11,449 | 82 | 0.72% |
Proof Silver Eagles |
||||
| Old Sales |
Latest Sales |
Gain/ Loss |
% Increase |
|
| 2019-W Proof Silver Eagle | 236,209 | 242,086 | 5,877 | 2.49% |
| 2019-W Proof Silver Eagle (Bulk – 40 Coins) | 718 | 723 | 5 | 0.70% |
| 2018-S Proof Silver Eagle* | 158,785 | 158,785 | – | – |
| 2018-W Proof Silver Eagle | 344,804 | 345,182 | 378 | 0.11% |
| 2018-W Proof Silver Eagle (Bulk Pack – 210 Coins) | 182 | 182 | – | – |
| 2017-W Proof Silver Eagle* | 390,186 | 390,186 | – | – |
| 2017-W Proof Silver Eagle (Bulk Pack – 210 Coins)* | 240 | 240 | – | – |
Uncirculated Silver Eagles |
||||
| Old Sales |
Latest Sales |
Gain/ Loss |
% Increase |
|
| 2018 | 133,797 | 137,306 | 3,509 | 2.62% |
| 2017* | 176,739 | 176,739 | – | – |
2018 Proof American Eagle Gold Coins |
||||
| Old Sales |
Latest Sales |
Gain/ Loss |
% Increase |
|
| 1 oz | 6,743 | 6,799 | 56 | 0.83% |
| 1/2 oz* | 1,815 | 1,815 | – | – |
| 1/4 oz | 4,622 | 4,622 | – | – |
| 1/10 oz | 14,016 | 14,016 | – | – |
| 4-Coin Set | 7,639 | 7,718 | 79 | 1.03% |
2017 Proof American Eagle Gold Coins |
||||
| Old Sales |
Latest Sales |
Gain/ Loss |
% Increase |
|
| 1 oz* | 9,245 | 9,245 | – | – |
| 1/2 oz* | 2,904 | 2,904 | – | – |
| 1/4 oz* | 4,702 | 4,702 | – | – |
| 1/10 oz* | 11,163 | 11,163 | – | – |
| 4-Coin Set* | 9,811 | 9,811 | – | – |
Uncirculated American Eagle Gold Coins |
||||
| Old Sales |
Latest Sales |
Gain/ Loss |
% Increase |
|
| 2018 | 8,034 | 8,076 | 42 | 0.52% |
| 2017* | 5,800 | 5,800 | – | – |
Proof American Buffalo Gold Coins |
||||
| Old Sales |
Latest Sales |
Gain/ Loss |
% Increase |
|
| 2018 Proof Gold Buffalo | 15,722 | 15,741 | 19 | 0.12% |
| 2017 Proof Gold Buffalo* | 15,810 | 15,810 | – | – |
Proof American Platinum Eagle |
||||
| Old Sales |
Latest Sales |
Gain/ Loss |
% Increase |
|
| 2019 | 7,441 | 7,876 | 435 | 5.85% |
| 2018 | 13,057 | 13,086 | 29 | 0.22% |
| 2017* | 8,890 | 8,890 | – | – |
Proof Palladium Eagle |
||||
| Old Sales |
Latest Sales |
Gain/ Loss |
% Increase |
|
| 2018* | 14,986 | 14,986 | – | – |
America the Beautiful 5 Oz Silver Coins |
||||
| Old Sales |
Latest Sales |
Gain/ Loss |
% Increase |
|
| 2019-P Lowell Five Ounce Silver Uncirculated Coin | 13,571 | 13,851 | 280 | 2.06% |
| 2018-P Block Island Silver Coins | 15,117 | 15,152 | 35 | 0.23% |
| 2018-P Cumberland Island Silver Coins | 15,411 | 15,437 | 26 | 0.17% |
| 2018-P Voyageurs Silver Coins | 16,672 | 16,821 | 149 | 0.89% |
| 2018-P Apostle Islands Silver Coins | 16,798 | 16,801 | 3 | 0.02% |
| 2018-P Pictured Rocks Silver Coins* | 17,773 | 17,773 | – | – |
| 2017-P George Rogers Clark Silver Coins* | 14,731 | 14,731 | – | – |
| 2017-P Ellis Island Silver Coins* | 17,670 | 17,670 | – | – |
| 2017-P Ozark Riverways Silver Coins | 17,694 | 17,694 | – | – |
| 2017-P Frederick Douglass Silver Coins* | 17,678 | 17,678 | – | – |
| 2017-P Effigy Mounds Silver Coins* | 17,251 | 17,251 | – | – |
Presidential Silver Medals |
||||
| Old Sales |
Latest Sales* |
Gain/ Loss |
% Increase |
|
| 2019 Thomas Jefferson Presidential Silver Medal | 9,464 | 9,958 | 494 | 5.22% |
| 2018 George Washington Presidential Silver Medal | 18,961 | 19,146 | 185 | 0.98% |
| 2018 John Adams Presidential Silver Medal | 14,837 | 14,976 | 139 | 0.94% |
2018 American Innovation $1 Coins |
||||
| Old Sales |
Latest Sales |
Gain/ Loss |
% Increase |
|
| Proof Coin (S) | 165,262 | 168,062 | 2,800 | 1.69% |
| 25-coin roll set (P) | 9,556 | 9,971 | 415 | 4.34% |
| 25-coin roll set (D) | 9,115 | 9,613 | 498 | 5.46% |
| 100-coin bag (P) | 2,875 | 2,910 | 35 | 1.22% |
| 100-coin bag (D) | 2,903 | 2,905 | 2 | 0.07% |
Native American Dollar Rolls |
||||
| Old Sales |
Latest Sales |
Gain/ Loss |
% Increase |
|
| 2019-dated 25-coin roll set (P) | 10,100 | 10,705 | 605 | 5.99% |
| 2019-dated 25-coin roll set (D) | 10,047 | 10,650 | 603 | 6.00% |
| 2019-dated 100-coin bag (P) | 768 | 836 | 68 | 8.85% |
| 2019-dated 100-coin bag (D) | 871 | 940 | 69 | 7.92% |
| 2019-dated 250-coin box (P) | 865 | 920 | 55 | 6.36% |
| 2019-dated 250-coin box (D) | 1,431 | 1,488 | 57 | 3.98% |
| 2018-dated 25-coin roll set (P) | 16,095 | 16,135 | 40 | 0.25% |
| 2018-dated 25-coin roll set (D) | 15,300 | 15,336 | 36 | 0.24% |
| 2018-dated 100-coin bag (P) | 1,715 | 1,725 | 10 | 0.58% |
| 2018-dated 100-coin bag (D) | 1,611 | 1,619 | 8 | 0.50% |
| 2018-dated 250-coin box (P) | 1,865 | 1,865 | – | – |
| 2018-dated 250-coin box (D) | 1,874 | 1,874 | – | – |
| 2017-dated 25-coin roll set (P)* | 16,953 | 16,953 | – | – |
| 2017-dated 25-coin roll set (D)* | 16,225 | 16,225 | – | – |
| 2017-dated 100-coin bag (P)* | 1,912 | 1,912 | – | – |
| 2017-dated 100-coin bag (D)* | 1,784 | 1,784 | – | – |
| 2017-dated 250-coin box (P)* | 2,136 | 2,136 | – | – |
| 2017-dated 250-coin box (D)* | 2,186 | 2,186 | – | – |
Kennedy Half Dollar Rolls |
||||
| Old Sales |
Latest Sales |
Gain/ Loss |
% Increase |
|
| 2018-dated 200-coin bag (P&D) | 7,906 | 8,098 | 192 | 2.43% |
| 2018-dated 2-roll set (P&D) | 20,441 | 20,553 | 112 | 0.55% |
| 2017-dated 200-coin bag (P&D)* | 10,321 | 10,321 | – | – |
| 2017-dated 2-roll set (P&D)* | 23,747 | 23,747 | – | – |
America the Beautiful Quarters Uncirculated Coin Set |
||||
| Old Sales |
Latest Sales |
Gain/ Loss |
% Increase |
|
| 2018 Issue | 30,814 | 30,949 | 135 | 0.44% |
| 2017 Issue* | 29,972 | 29,972 | – | – |
America the Beautiful Quarters Circulating Coin Set |
||||
| Old Sales |
Latest Sales |
Gain/ Loss |
% Increase |
|
| 2018 Issue | 19,388 | 19,456 | 68 | 0.35% |
| 2017 Issue | 23,712 | 23,747 | 35 | 0.15% |
| 2016 Issue* | 23,958 | 23,958 | – | – |
America the Beautiful Quarters Three-Coin Sets |
||||
| Old Sales |
Latest Sales |
Gain/ Loss |
% Increase |
|
| Lowell | 10,668 | 11,193 | 525 | 4.92% |
| Block Island | 12,588 | 12,630 | 42 | 0.33% |
| Cumberland Island | 12,654 | 12,689 | 35 | 0.28% |
| Voyageurs | 13,533 | 13,562 | 29 | 0.21% |
| Apostle Islands | 13,714 | 13,738 | 24 | 0.18% |
| Pictured Rocks | 15,192 | 15,218 | 26 | 0.17% |
| George Rogers Clark | 13,601 | 13,619 | 18 | 0.13% |
| Ellis Island* | 16,947 | 16,947 | – | – |
| Ozark Riverways | 14,411 | 14,428 | 17 | 0.12% |
| Frederick Douglass | 14,841 | 14,856 | 15 | 0.10% |
| Effigy Mounds | 14,012 | 14,020 | 8 | 0.06% |
| Fort Moultrie* | 13,306 | 13,306 | – | – |
| Theodore Roosevelt* | 16,072 | 16,072 | – | – |
| Harpers Ferry* | 14,345 | 14,345 | – | – |
| Cumberland Gap* | 14,973 | 14,973 | – | – |
| Shawnee* | 15,474 | 15,474 | – | – |
| Saratoga* | 14,950 | 14,950 | – | – |
| Bombay Hook* | 13,400 | 13,400 | – | – |
| Blue Ridge Parkway* | 17,165 | 17,165 | – | – |
| Kisatchie Set* | 15,196 | 15,196 | – | – |
| Homestead Set* | 16,114 | 16,114 | – | – |
| Everglades Set* | 14,373 | 14,373 | – | – |
| Great Sand Dunes Set* | 14,119 | 14,119 | – | – |
| Arches Three-Coin Set* | 15,859 | 15,859 | – | – |
| Shenandoah Three-Coin Set* | 17,351 | 17,351 | – | – |
| Great Smoky Mountains Set* | 18,588 | 18,588 | – | – |
| Mount Rushmore Quarters Set* | 17,924 | 17,924 | – | – |
| Fort McHenry Quarters Set* | 16,345 | 16,345 | – | – |
| Great Basin Quarters Set* | 15,526 | 15,526 | – | – |
| Perry’s Victory Quarters Set* | 17,643 | 17,643 | – | – |
| White Mountain Quarters Set* | 18,056 | 18,056 | – | – |
| Denali Quarters Set* | 18,193 | 18,193 | – | – |
| Hawaii Volcanoes Quarters Set* | 19,947 | 19,947 | – | – |
| Acadia Quarters Set* | 19,940 | 19,940 | – | – |
| Chaco Culture Quarters Set* | 20,028 | 20,028 | – | – |
| El Yunque Quarters Set* | 19,891 | 19,891 | – | – |
| Chickasaw Quarters Set* | 16,184 | 16,184 | – | – |
| Vicksburg Quarters Set* | 18,095 | 18,095 | – | – |
| Olympic Quarters Set* | 17,718 | 17,718 | – | – |
| Glacier Quarters Set* | 19,046 | 19,046 | – | – |
| Gettysburg Quarters Set* | 22,869 | 22,869 | – | – |
| Mount Hood Quarters Set* | 18,384 | 18,384 | – | – |
| Grand Canyon Quarters Set* | 22,133 | 22,133 | – | – |
| Yosemite Quarters Set* | 22,154 | 22,154 | – | – |
| Yellowstone Quarters Set* | 25,048 | 25,048 | – | – |
| Hot Springs Quarters Set* | 23,203 | 23,203 | – | – |
2019 Lowell Quarters |
||||
| Old Sales |
Latest Sales |
Gain/ Loss |
% Increase |
|
| 100-Coin Bag (S) | 2,485 | 2,571 | 86 | 3.46% |
| 40-Coin Roll (S) | 2,525 | 2,692 | 167 | 6.61% |
| Three-Roll Set | 6,616 | 6,856 | 240 | 3.63% |
| 100-Coin Bag (P) | 1,695 | 1,764 | 69 | 4.07% |
| 100-Coin Bag (D) | 1,654 | 1,717 | 63 | 3.81% |
| Two-Roll Set | 5,472 | 5,564 | 92 | 1.68% |
2018 Block Island Quarters |
||||
| Old Sales |
Latest Sales |
Gain/ Loss |
% Increase |
|
| 100-Coin Bag (S) | 3,544 | 3,549 | 5 | 0.14% |
| 40-Coin Roll (S) | 3,272 | 3,317 | 45 | 1.38% |
| Three-Roll Set | 7,763 | 7,789 | 26 | 0.33% |
| 100-Coin Bag (P) | 1,969 | 1,971 | 2 | 0.10% |
| 100-Coin Bag (D) | 1,957 | 1,958 | 1 | 0.05% |
| Two-Roll Set | 5,863 | 5,874 | 11 | 0.19% |
2018 Cumberland Island Quarters |
||||
| Old Sales |
Latest Sales |
Gain/ Loss |
% Increase |
|
| 100-Coin Bag (S) | 3,790 | 3,792 | 2 | 0.05% |
| 40-Coin Roll (S) | 3,505 | 3,512 | 7 | 0.20% |
| Three-Roll Set | 7,974 | 7,982 | 8 | 0.10% |
| 100-Coin Bag (P) | 2,052 | 2,053 | 1 | 0.05% |
| 100-Coin Bag (D) | 1,912 | 1,912 | – | – |
| Two-Roll Set | 6,059 | 6,061 | 2 | 0.03% |
2018 Voyageurs Islands Quarters |
||||
| Old Sales |
Latest Sales |
Gain/ Loss |
% Increase |
|
| 100-Coin Bag (S) | 3,753 | 3,758 | 5 | 0.13% |
| 40-Coin Roll (S) | 3,521 | 3,526 | 5 | 0.14% |
| Three-Roll Set | 8,248 | 8,260 | 12 | 0.15% |
| 100-Coin Bag (P) | 2,067 | 2,067 | – | – |
| 100-Coin Bag (D) | 2,107 | 2,107 | – | – |
| Two-Roll Set | 6,198 | 6,200 | 2 | 0.03% |
2018 Apostle Islands Quarters |
||||
| Old Sales |
Latest Sales |
Gain/ Loss |
% Increase |
|
| 100-Coin Bag (S) | 4,067 | 4,068 | 1 | 0.02% |
| 40-Coin Roll (S) | 3,620 | 3,627 | 7 | 0.19% |
| Three-Roll Set | 8,296 | 8,303 | 7 | 0.08% |
| 100-Coin Bag (P) | 2,071 | 2,071 | – | – |
| 100-Coin Bag (D) | 2,066 | 2,066 | – | – |
| Two-Roll Set | 6,296 | 6,298 | 2 | 0.03% |
2018 Pictured Rocks Quarters |
||||
| Old Sales |
Latest Sales |
Gain/ Loss |
% Increase |
|
| 100-Coin Bag (S) | 4,159 | 4,159 | – | – |
| 40-Coin Roll (S) | 3,842 | 3,842 | – | – |
| Three-Roll Set | 8,904 | 8,906 | 2 | 0.02% |
| 100-Coin Bag (P) | 2,243 | 2,243 | – | – |
| 100-Coin Bag (D) | 2,369 | 2,369 | – | – |
| Two-Roll Set | 6,520 | 6,520 | – | – |
Visit the United States Mint website at http://catalog.usmint.gov for product information.


