U.S. coin production picked up in April, topped one billion coins for a fourth straight month, and was quicker than a year ago, according to the latest round of manufacturing figures from the United States Mint.
In the headline monthly figure, U.S. Mint coining presses struck over 1.25 billion coins to mark gains of 18.9% from March and 42.7% from April 2018.
Here’s how the month ranks against others in the past year:
April 2018 to April 2019 Circulating Coin Production
| Month | Mintages | Rank |
| April 2019 | 1,253.76 M | 6 |
| March 2019 | 1,054.90 M | 8 |
| February 2019 | 1,256.10 M | 5 |
| January 2019 | 1,507.30 M | 1 |
| December 2018 | 560.64 M | 13 |
| November 2018 | 1,031.24 M | 9 |
| October 2018 | 1,382.18 M | 3 |
| September 2018 | 976.82 M | 10 |
| August 2018 | 831.56 M | 12 |
| July 2018 | 1,403.16 M | 2 |
| June 2018 | 1,198.34 M | 7 |
| May 2018 | 1,291.76 M | 4 |
| April 2018 | 878.74 M | 11 |
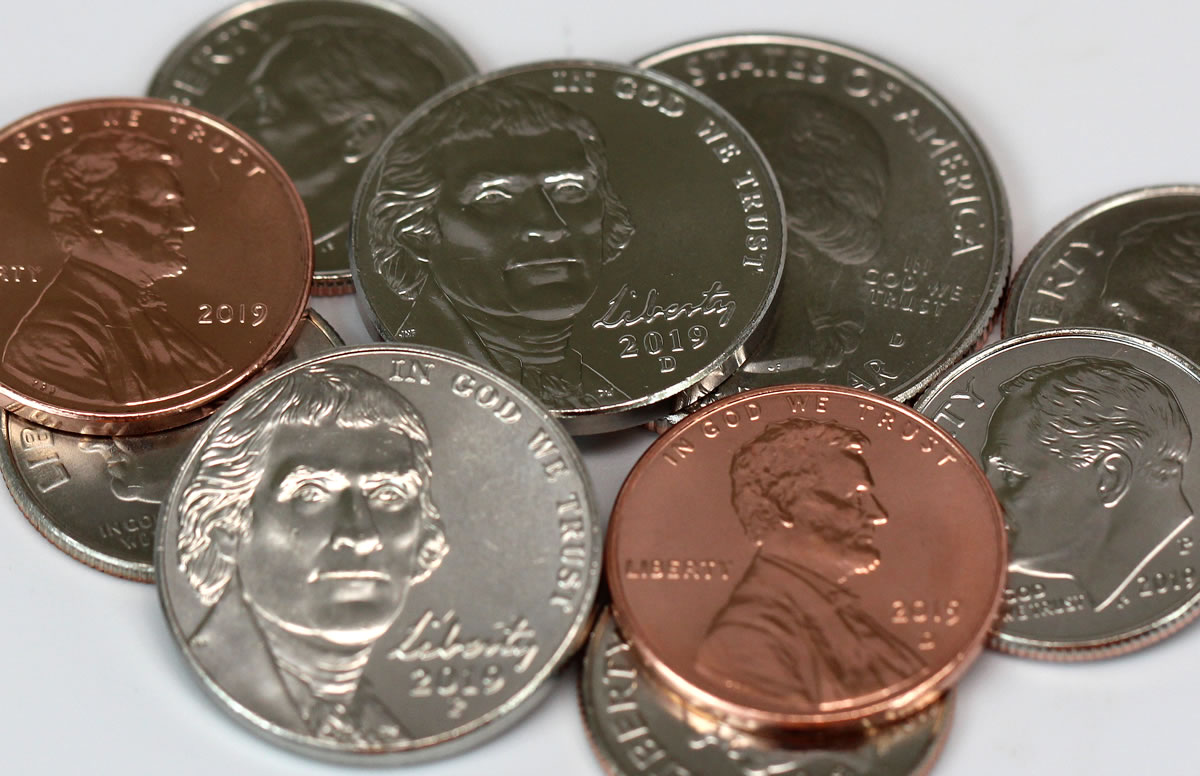
The Federal Reserve always orders more 1-cent coins than any other denomination even with the latest data showing it costs the U.S. Mint 2.06 cents to make and distribute each one. The bureau produced 740.8 million Lincoln cents in April, representing 59.1% of the circulating-quality coins produced for the month.
Month-Over-Month
In month-over month comparisons for coins used daily by Americans, production totals in April saw:
- 25.5% more Lincoln cents,
- 2.1% fewer Jefferson nickels,
- 5.5% more Roosevelt dimes, and
- 27.9% more America the Beautiful quarter dollars.
Native American $1 Coins and Kennedy half-dollars are no longer ordered by Federal Reserve Banks but they are still made in circulating finish for coin collectors. In January, the U.S. Mint tends to strike both coins to the expected amounts needed for the entire year.
That said, the bureau’s data for February did show an increase of 140,000 in 2019-D Native American dollars. Reported mintages for the space-themed piece are at 1.54 million for Denver and 1.4 million for Philadelphia for a combined 2.94 million coins — up from last year’s dollar mintages by the added 140,000.
Mintages for the 2019 Kennedy half-dollar remained the same for a third straight month, totaling 3.4 million coins with equal splits between the Denver and Philadelphia Mints. Last year’s half-dollar was the most produced since the one from 2001. It saw 6.1 million from Denver and 4.8 million from Philadelphia for a combined 10.9 million coins.
Here’s a summary of all circulating-quality coins produced last month:
US Mint Circulating Coin Production in April 2019
| Denomination | Denver | Philadelphia | Total |
| Lincoln Cents | 336,000,000 | 404,800,000 | 740,800,000 |
| Jefferson Nickels | 48,000,000 | 63,360,000 | 111,360,000 |
| Roosevelt Dimes | 100,000,000 | 121,000,000 | 221,000,000 |
| ATB Quarters | 88,200,000 | 92,400,000 | 180,600,000 |
| Kennedy Half Dollars | 0 | 0 | 0 |
| Native American $1s | 0 | 0 | 0 |
| Total | 572,200,000 | 681,560,000 | 1,253,760,000 |
U.S. Mint facilities in Denver and Philadelphia manufacture all of America’s coins for commerce. Last month, the Philadelphia Mint produced 681.56 million coins and the Denver Mint made 572.2 million coins.
Year-to-date, the Philadelphia Mint struck 2,543,440,000 coins and the Denver Mint struck 2,528,620,000 coins for a combined 5,072,060,000 coins — 14% more than the 4,449,714,000 coins minted through the first four months of 2018.
This next table lists 2019 coin production totals by denomination and by U.S. Mint facility:
YTD 2019 Circulating Coin Production by Denomination
| 1 ¢ | 5 ¢ | 10 ¢ | 25 ¢ | 50 ¢ | N.A. $1 | Total: | |
|---|---|---|---|---|---|---|---|
| Denver | 1466.4M | 229.48M | 459.5M | 370M | 1.7M | 1.54M | 2528.62M |
| Philadelphia | 1466.4M | 260.64M | 498.5M | 314.8M | 1.7M | 1.4M | 2543.44M |
| Total | 2932.8M | 490.12M | 958M | 684.8M | 3.4M | 2.94M | 5072.06M |
If the current production pace stretched through to December, the annual 2019 mintage total would reach 15.2 billion coins. The Mint made over 13.1 billion coins for circulation in 2018.
Mintages by Unique Design
So far, the U.S. Mint has released three annually issued coins with one-year-only designs. They include:
- the 2019 Lowell National Historical quarter for Massachusetts, released on Feb. 4;
- the 2019 Native American $1 Coin, released on Feb. 13; and
- the 2019 American Memorial Park quarter for Northern Mariana Islands, released on April 1.
The following table offers a breakdown of this year’s mintages by coin design:
2019 Circulating Coin Production by Design
| Denver | Philadelphia | Total | |
| Lincoln Cents | 1,466,400,000 | 1,466,400,000 | 2,932,800,000 |
| Jefferson Nickels | 229,480,000 | 260,640,000 | 490,120,000 |
| Roosevelt Dimes | 459,500,000 | 498,500,000 | 958,000,000 |
| Lowell National Historical Park Quarter (MA) | 182,200,000 | 165,800,000 | 348,000,000 |
| American Memorial Park Quarter (MP) | – | – | – |
| War in the Pacific National Historical Park Quarter (GU) | – | – | – |
| San Antonio Missions National Historical Park Quarter (TX) | – | – | – |
| Frank Church River of No Return Wilderness Quarter (ID) | – | – | – |
| Kennedy Half-Dollars | 1,700,000 | 1,700,000 | 3,400,000 |
| Native American $1 Coins | 1,540,000 | 1,400,000 | 2,940,000 |
| Total | 2,340,820,000 | 2,394,440,000 | 4,735,260,000 |
There are 336.8 million in quarters that the U.S. Mint has yet to officially assign to a design. These are likely American Memorial Park quarters that started circulating last month.


