U.S. coin production fell in April to a four-month low and also declined from a year ago, according to manufacturing figures published by the United States Mint.
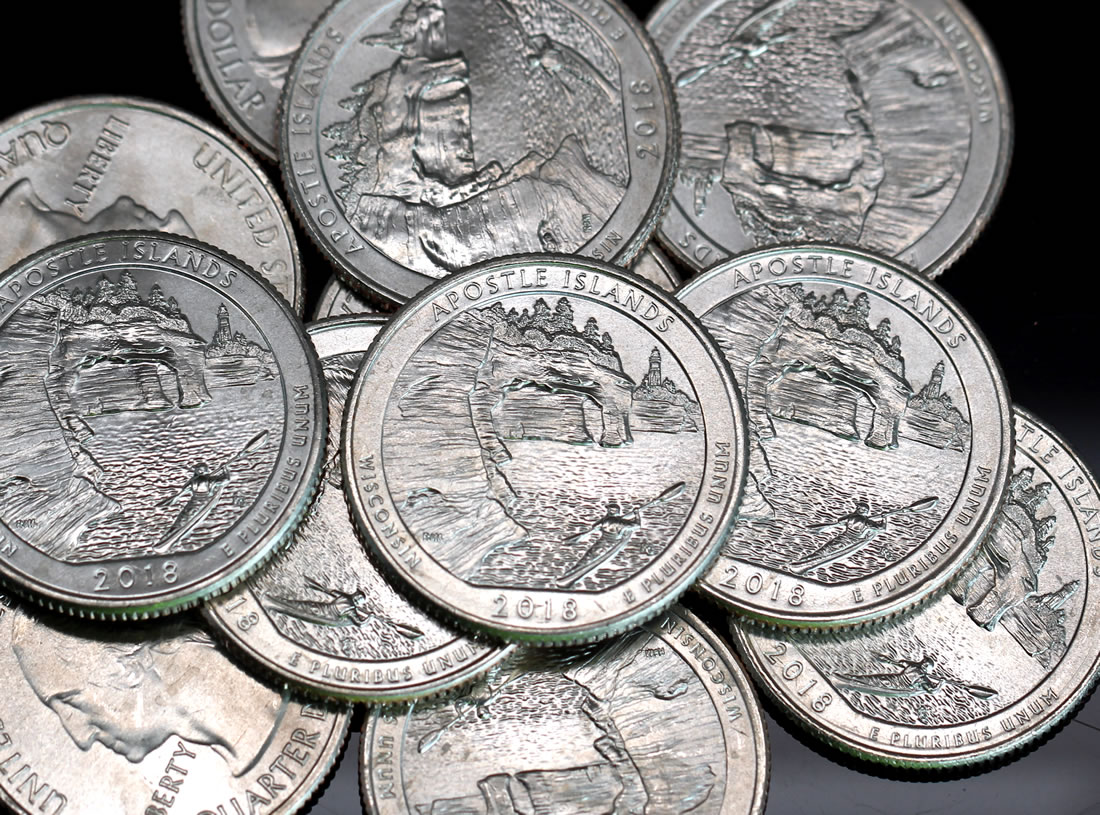
Mint data also shows mintages for Wisconsin’s Apostle Islands National Lakeshore quarter, the second of five 2018-dated quarters with unique designs.
In the headline figure for April, coining presses struck cents, nickels, dimes, and quarters in amounts totaling 878.74 million coins — 2.7% fewer than struck in March and 8.4% less than pressed in April 2017.
Here’s how the month stack up against others in the past year:
April 2017 to April 2018 Circulating Coin Production
| Month | Mintages | Rank |
| April 2018 | 878.74 M | 12 |
| March 2018 | 902.924 M | 11 |
| February 2018 | 1,066.51 M | 9 |
| January 2018 | 1,601.54 M | 1 |
| December 2017 | 762.86 M | 13 |
| November 2017 | 1,346.26 M | 3 |
| October 2017 | 1,423.54 M | 2 |
| September 2017 | 1,316.22 M | 4 |
| August 2017 | 1,167.48 M | 7 |
| July 2017 | 1,254.74 M | 5 |
| June 2017 | 1,252.88 M | 6 |
| May 2017 | 1,156.34 M | 8 |
| April 2017 | 959.54 M | 10 |
The Federal Reserve always orders more 1-cent coins than any other denomination even as it costs the U.S. Mint 1.82 cents to make and distribute each one. The bureau struck 538.8 million Lincoln cents in April, representing 61.3% of the circulating-quality coins produced for the month.
Month-Over-Month
In month-over month comparisons for coins used daily by Americans, production totals in April saw:
- 3.6% fewer Lincoln cents,
- 41.1% fewer Jefferson nickels,
- 10.8% more Roosevelt dimes, and
- 23.2% more America the Beautiful quarter dollars.
Native American $1 Coins and Kennedy half-dollars are no longer ordered by Federal Reserve Banks but they are still made in circulating-quality for coin collectors. In January, the U.S. Mint tends to strike both coins to the expected amounts needed for the entire year.
Higher Kennedy Half-Dollar Mintages
However, the agency in February did produce 1.8 million more 2018-D Kennedy half-dollars. Then in March, it struck another 3.2 million from Denver and 1.2 million more for Philadelphia. None were made in April. Mintages for the half-dollar are at 5.4 million from Denver and 4.8 million from Philadelphia for a combined 10.2 million coins — the most since 2001 and more than doubling 2017. Last year’s release ended with splits of 2.9 million from Denver and 1.8 million from Philadelphia for a combined 4.7 million coins.
Here’s a summary of all coins produced for circulation last month:
US Mint Circulating Coin Production in April 2018
| Denomination | Denver | Philadelphia | Total |
| Lincoln Cents | 269,600,000 | 269,200,000 | 538,800,000 |
| Jefferson Nickels | 30,720,000 | 30,720,000 | 61,440,000 |
| Roosevelt Dimes | 53,500,000 | 44,000,000 | 97,500,000 |
| ATB Quarters | 88,400,000 | 92,600,000 | 181,000,000 |
| Kennedy Half Dollars | 0 | 0 | 0 |
| Native American $1s | 0 | 0 | 0 |
| Total | 442,220,000 | 436,520,000 | 878,740,000 |
U.S. Mint facilities in Denver and Philadelphia manufacture all of America’s coins for commerce. Last month, the Denver Mint struck 442.22 million coins and the Philadelphia Mint made 436.52 million coins.
For the year so far, the Denver Mint made 2,145,940,000 coins and the Philadelphia Mint struck 2,303,774,000 coins for a combined 4,449,714,000 coins — 14.1% fewer than the 5,179,040,000 coins minted in through the first four months of 2017.
This next table lists 2018 coin production totals by denomination and by U.S. Mint facility:
YTD 2018 Circulating Coin Production by Denomination
| 1 ¢ | 5 ¢ | 10 ¢ | 25 ¢ | 50 ¢ | N.A. $1 | Total: | |
|---|---|---|---|---|---|---|---|
| Denver | 1322M | 212.64M | 281M | 322.8M | 5.4M | 2.1M | 2145.94M |
| Philadelphia | 1420.8M | 213.36M | 311.5M | 351.914M | 4.8M | 1.4M | 2303.774M |
| Total | 2742.8M | 426M | 592.5M | 674.714M | 10.2M | 3.5M | 4449.714M |
The 2018 monthly average of about 1.11 billion coins tracks over 12 months to roughly 13.3 billion coins. In 2017, the U.S. Mint produced over 14.8 billion coins for circulation — the third quickest for a year since 2001, after the more than 16 billion coins were made in 2017 and the over 17 billion coins were made in 2015.
Apostle Island Quarter Mintages
So far, the U.S. Mint has released three 2018-dated coins with one-year-only designs. They include the:
- 2018 Pictured Rocks National Lakeshore quarter for Michigan, released on Feb 5.
- 2018 Native American $1 Coin, released on Feb. 15.
- 2018 Apostle Islands National Lakeshore quarter for Wisconsin, released on April 9.
Reported mintages for the 2018 Native American dollars are 2.1 million from Denver and 1.4 million from Philadelphia for a combined 3.5 million coins. Last year’s release ended with splits of 1.54 million from Denver and 1.82 million from Philadelphia for 3.36 million coins.
The U.S. Mint this month published Apostle Islands quarter mintages for the first time. They came in at 137.8 million from Denver and 158.2 million from Philadelphia for 296 million quarters. That’s the lowest combined total for a quarter design since the first release in 2014, but it’s nowhere near mintage lows in the series.
The following table offers a breakdown of this year’s mintages by coin design:
2018 Circulating Coin Production by Design
| Denver | Philadelphia | Total | |
| Lincoln Cents | 1,322,000,000 | 1,420,800,000 | 2,742,800,000 |
| Jefferson Nickels | 212,640,000 | 213,360,000 | 426,000,000 |
| Roosevelt Dimes | 281,000,000 | 311,500,000 | 592,500,000 |
| Pictured Rocks National Lakeshore Quarter (MI) | 182,600,000 | 186,714,000 | 369,314,000 |
| Apostle Islands National Lakeshore Quarter (WI) | 137,800,000 | 158,200,000 | 296,000,000 |
| Voyageurs National Park Quarter (MN) | 0 | 0 | 0 |
| Cumberland Island National Seashore Quarter (GA) | 0 | 0 | 0 |
| Block Island National Wildlife Refuge Quarter (RI) | 0 | 0 | 0 |
| Kennedy Half-Dollars | 5,400,000 | 4,800,000 | 10,200,000 |
| Native American $1 Coins | 2,100,000 | 1,400,000 | 3,500,000 |
| Total | 2,143,540,000 | 2,296,774,000 | 4,440,314,000 |
There are 9.4 million in quarters that the U.S. Mint hasn’t officially assigned to a design yet. These are likely a portion of the upcoming Voyageurs National Park quarter for Minnesota. They launched into circulation on June 11.


