Gold and silver futures advanced for a third straight session Thursday, each scoring their highest settlements since early November.
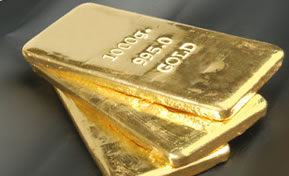
Gold for June delivery tacked on $10.40, or 0.8%, to finish at $1,288.50 an ounce on the Comex division of the New York Mercantile Exchange. The close is the highest since Nov. 4 when gold prices ended at $1,304.50 an ounce.
"The gold market continues to see an updraft from safe haven demand amid a rise in geopolitical tensions," Jim Wyckoff, a senior analyst at Kitco Metals Inc., said in a report. "A slide in the U.S. dollar index this week also favors the precious metals market bulls. The near-term chart postures for gold and silver have turned more bullish this week, and that’s inviting more technical buyers."
Gold futures ranged from a low of $1,283.80 to a high of $1,290.70. They added 0.3% on Wednesday, gained 1.6% on Tuesday and dipped 0.3% on Monday. They advanced 2.5% for the week.
Silver for May delivery settled up 21 cents, or 1.2%, to $18.51 an ounce. The close is the highest since Nov. 10 when prices ended at $18.737 an ounce. Silver futures traded between $18.41 and $18.61. They climbed 0.3% on Wednesday, rose 1.9% on Tuesday and dropped 1.3% on Monday. For the full trading week, they gained 2%.
In other precious metals futures:
-
July platinum rose $9.50, or 1%, to $977.40 an ounce, ranging from $971.40 to $981.10.
- Palladium dipped 40 cents, or less than 0.1%, to $795.90 an ounce, trading between $791.20 and $809.85.
The two metals split on the week with platinum up 1.5% and palladium down 1%.
London Precious Metals Prices
London precious metals prices gained on Thursday and for the week. In comparing their levels from Wednesday PM to Thursday PM:
- Gold added $9.85, or 0.8%, to $1,284.15 an ounce.
- Silver rose 25 cents, or 1.4%, to $18.56 an ounce.
- Platinum climbed $13, or 1.4%, to $975 an ounce, and
- Palladium added $13, or 1.6%, to $807 an ounce.
Their weekly totals advanced by 1.4% for gold, 0.9% for silver, 0.8% for platinum and 0.1% for palladium.
US Mint Bullion Coin Sales in 2017
U.S. Mint bullion products registered slower weekly sales. In the latest week-over-week comparisons:
-
Gold coins advanced by 2,000 ounces compared to 3,500 ounces previously. Splits include 1,000 ounces in American Gold Eagles compared to 2,500 ounces previously and 1,000 ounces in American Gold Buffalo to match last week.
-
Silver coins advanced by 136,500 ounces compared to 306,500 ounces previously. Splits include 125,000 ounces in American Silver Eagles versus 255,000 ounces previously and 11,500 ounces in ATB 5-ounce silver bullion coins compared to 51,500 ounces previously.
Below is a sales breakdown of U.S. bullion products with columns listing the number of coins sold during varying periods. Products with an asterisk (*) are no longer available.
| US Mint Bullion Sales (# of coins) | ||||||
|---|---|---|---|---|---|---|
| Thursday Sales | Last Week | This Week | Mar Sales | April Sales | 2017 Sales | |
| $100 American Eagle 1 Oz Platinum Coin | 0 | 0 | 0 | 0 | 0 | 20,000 |
| $50 American Eagle 1 Oz Gold Coin | 0 | 1,500 | 1,000 | 16,000 | 2,500 | 126,000 |
| $25 American Eagle 1/2 Oz Gold Coin | 0 | 0 | 0 | 1,000 | 0 | 25,000 |
| $10 American Eagle 1/4 Oz Gold Coin | 0 | 2,000 | 0 | 4,000 | 2,000 | 46,000 |
| $5 American Eagle 1/10 Oz Gold Coin | 0 | 5,000 | 0 | 35,000 | 5,000 | 195,000 |
| $50 American Buffalo 1 Oz Gold Coin | 0 | 1,000 | 1,000 | 8,500 | 2,000 | 57,500 |
| $1 American Eagle 1 Oz Silver Coin | 0 | 255,000 | 125,000 | 1,615,000 | 380,000 | 8,337,500 |
| 2017 Frederick Douglass 5 Oz Silver Coin | 0 | 9,700 | 2,300 | N/A | 12,000 | 12,000 |
| 2017 Effigy Mounds 5 Oz Silver Coin | 0 | 600 | 0 | 200 | 600 | 20,300 |
This article was updated to include bullion weekly figures.


