Far fewer coins for circulation came out of American manufacturing facilities in Denver and Philadelphia last month, U.S. Mint coin production data for February shows.
New figures also reveal mintages for the Great Smoky Mountains National Park Quarter, which is the inaugural 2014 release in the America the Beautiful Quarters series, and they show mintages for this year’s first two Presidential $1 Coins honoring Warren G. Harding and Calvin Coolidge.
Coin production levels this year are starting out much like last year with a huge opening-month spike followed by a sharp monthly retreat. United States Mint plants struck 939,040,000 circulating quality coins in February, down 35.2% from January’s more than 1.4 billion coins but nearly on par with the 939,980,000 coins from February 2013. The following table offers recent monthly coin production totals and how they rank against each other:
2013 – 2014 February Coin Production Figures
| Month | Mintages | Rank |
| February 2014 | 939.04 M | 10 |
| January 2014 | 1,449.38 M | 1 |
| December 2013 | 285.96 M | 13 |
| November 2013 | 991.14 M | 8 |
| October 2013 | 1,220.38 M | 3 |
| September 2013 | 1,099.34 M | 5 |
| August 2013 | 724.91 M | 12 |
| July 2013 | 1,225.96 M | 2 |
| June 2013 | 1,070.12 M | 7 |
| May 2013 | 1,084.36 M | 6 |
| April 2013 | 1,117.23 M | 4 |
| March 2013 | 932.56 M | 11 |
| February 2013 | 939.98 M | 9 |
As some background, the U.S. Mint does not dictate how many coins to produce for circulation. It’s the Federal Reserve that orders coins from the Mint based on usage trends and coinage requests from financial institutions around the country.
Lincoln cents always stand out as the most ordered denomination for trade and commerce. We can’t seem to get enough of them even though it costs 1.83 cents to produce and distribute each one. The bureau in February struck 551.6 million pennies, or 58.7% of all the circulating-coins produced for the month.
For all coins used every day by Americans, each logged month-over-month production declines of:
- 34.6% for Lincoln cents,
- 29.5% for Jefferson nickels,
- 36.3% for Roosevelt dimes, and
- 35.5% for America the Beautiful Quarters
Presidential $1 Coins, Native American $1 Coins and Kennedy halves are no longer ordered by Federal Reserve Banks but the U.S. Mint still make them in circulating-quality for collectors. In January, the Mint produced 2014 Native American $1 Coins and 2014 Kennedy half-dollars to the expected amounts needed for the entire year. It continues to strike Presidential $1 Coins, however. Here is a breakdown for all the circulating-quality coins made by the U.S. Mint in February:
US Mint Circulating Coin Production in February 2014
| Denomination | Denver | Philadelphia | Total |
| Lincoln Cents | 283,200,000 | 268,400,000 | 551,600,000 |
| Jefferson Nickels | 43,680,000 | 39,360,000 | 83,040,000 |
| Roosevelt Dimes | 76,000,000 | 79,500,000 | 155,500,000 |
| 2013 ATB Quarters | 85,000,000 | 54,800,000 | 139,800,000 |
| Kennedy Half Dollars | 0 | 0 | 0 |
| Native American $1s | 0 | 0 | 0 |
| Presidential Dollars | 2,800,000 | 6,300,000 | 9,100,000 |
| Total | 490,680,000 | 448,360,000 | 939,040,000 |
U.S. Mint facilities in Philadelphia and Denver manufacture all of America’s circulating coins for commerce. In February, the Denver Mint produced 490.68 million coins and the Philadelphia Mint struck 448.36 million coins.
For the January through February period, the Denver Mint made 1,278,340,000 coins and the Philadelphia Mint produced 1,110,080,000 coins. That lifts the year-to-date total for both plants to 2,388,420,000 coins for a 10.4% increase over the 2,163,660,000 coins minted through the first two months of last year.
This next table offers 2014 coin production totals by denomination and by U.S. Mint facility:
YTD 2014 Circulating Coin Production by Denomination
| 1 ¢ | 5 ¢ | 10 ¢ | 25 ¢ | 50 ¢ | N.A. $1 | Pres $1 | Total: | |
|---|---|---|---|---|---|---|---|---|
| Denver | 722.M | 110.64M | 206.5M | 222.4M | 2.1M | 5.6M | 9.1M | 1278.34M |
| Philadelphia | 673.2M | 90.24M | 193.M | 134.2M | 2.5M | 3.08M | 13.86M | 1110.08M |
| Total | 1395.2M | 200.88M | 399.5M | 356.6M | 4.6M | 8.68M | 22.96M | 2388.42M |
This year’s monthly average of more than 1.194 billion coins sets 2014 on track for an annual coin production total of at least 14.3 billion coins. In 2013, the U.S. Mint struck more than 11.9 billion circulating quality coins.
2014 Great Smoky Mountains National Park Mintages
Quarter mintages increased last year as each new America the Beautiful design was released. It would not be surprising to see that same trend this year.
Mintage splits for this year’s first design, honoring Great Smoky Mountains National Park, are 99.4 million from Denver and 73.2 million from Philadelphia for a total of 172.6 million. The total is the 7th highest of the 21 America the Beautiful Quarters issued since the series debuted in 2010.
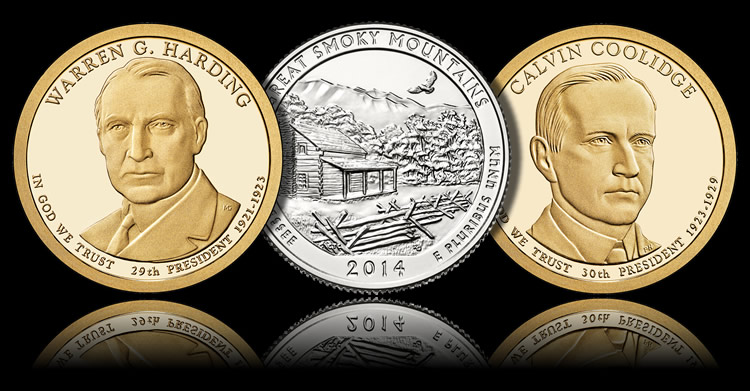
Harding and Coolidge $1 Coin Mintages
It appears that the U.S. Mint may be gently increasing mintages of the 2014 Presidential $1 Coins based on new totals of Warren G. Harding $1s at 9.94 million and Calvin Coolidge $1s at 8.26 million. Last year’s four Presidential dollars had an average mintage per design of just over 8.36 million. This year’s per coin average with two designs released is 9.1 million. And the last dollar design for 2014 features the very popular Franklin D. Roosevelt, which should bump the average up more.
U.S. Mint sold rolls and bags of Harding $1 coins became available on Feb. 6, 2014. Rolls and bags of Coolidge $1 coins are scheduled to launch in April.
The following table offers a breakdown of mintages by coin design:
2014 Circulating Coin Production / Mintages by Coin Design
| Denver | Philadelphia | 2014 Total | |
| Lincoln Cents | 722,000,000 | 673,200,000 | 1,395,200,000 |
| Jefferson Nickels | 110,640,000 | 90,240,000 | 200,880,000 |
| Roosevelt Dimes | 206,500,000 | 193,000,000 | 399,500,000 |
| Great Smoky Mountains Quarter | 99,400,000 | 73,200,000 | 172,600,000 |
| Shenandoah National Park Quarter | – | – | – |
| Arches National Park Quarter | – | – | – |
| Great Sand Dunes Quarter | – | – | – |
| Everglades National Park Quarter | – | – | – |
| Kennedy Half Dollars | 4,600,000 | 5,000,000 | 9,600,000 |
| Native American $1 | 1,820,000 | 1,820,000 | 3,640,000 |
| Warren G. Harding $1 | 3,780,000 | 6,160,000 | 9,940,000 |
| Calvin Coolidge $1 | 3,780,000 | 4,480,000 | 8,260,000 |
| Herbert Hoover $1 | – | – | – |
| Franklin D. Roosevelt $1 | – | – | – |
| Total | 1,152,520,000 | 1,047,100,000 | 2,199,620,000 |
In subtracting the totals by coin design from the overall production figures by denomination, two differences are found.
-
Mintages of 2014 America the Beautiful Quarters are higher by 184 million. These are likely Shenandoah National Park Quarters which enter circulation beginning on March 31, 2014.
-
Mintages of 2014 Presidential $1 Coins are higher by 4.76 million. The amount likely represents about half of the Herbert Hoover $1’s. Hoover dollars are expected to launch in June.
Circulating coin production figures are based on data aggregated from the U.S. Mint webpage at: http://www.usmint.gov/about_the_mint/?action=coin_production.


Why is it so hard to find a 2014 JFK 50c from ANY Mint?