More coins from manufacturing plants in Philadelphia and Denver shipped out in March than the previous month, U.S. Mint circulating coin production figures show.
New figures also reveal mintages for the third 2014 Presidential $1 Coin and the second 2014 America the Beautiful Quarter.
For the first quarter and year-to-date, United States Mint facilities produced 3,413,820,000 circulating-quality coins — the quickest yearly start since 2007.
1,025,400,000 coins were minted last month, marking an advance of 9.2% from February and a 10% increase over the same time last year. March ranks 8th busiest for the U.S. Mint through the last 12 months. The following table offers recent monthly coin production totals and how they rank against each other:
2013 – 2014 March Coin Production Figures
| Month | Mintages | Rank |
| March 2014 | 1,025.40 M | 8 |
| February 2014 | 939.04 M | 10 |
| January 2014 | 1,449.38 M | 1 |
| December 2013 | 285.96 M | 13 |
| November 2013 | 991.14 M | 9 |
| October 2013 | 1,220.38 M | 3 |
| September 2013 | 1,099.34 M | 5 |
| August 2013 | 724.91 M | 12 |
| July 2013 | 1,225.96 M | 2 |
| June 2013 | 1,070.12 M | 7 |
| May 2013 | 1,084.36 M | 6 |
| April 2013 | 1,117.23 M | 4 |
| March 2013 | 932.56 M | 11 |
As an always provided backdrop in our monthly coin production reports, the U.S. Mint does not decide how many coins to produce for circulation. It’s the Federal Reserve that orders coins from the Mint based on usage trends and coinage requests from financial institutions around the country.
Lincoln cents are always the most ordered denomination for trade and commerce even as it costs the Mint 1.83 cents to make and distribute each one. The bureau in March produced 611.2 million pennies, or 59.6% of all the circulating-coins produced for the month. There is no surprise there with percentages in the high 50’s and low 60s the norm.
For coins used every day by Americans, all but quarters logged month-over-month production gains. Increased amounts include:
- 10.8% for Lincoln cents,
- 11.6% for Jefferson nickels, and
- 13.2% for Roosevelt dimes
The production of America the Beautiful Quarters dipped 2.3%.
Presidential $1 Coins, Native American $1 Coins and Kennedy half-dollars are not ordered by Federal Reserve Banks but the U.S. Mint continues to make them in circulating-quality for coin collectors. In January, the U.S. Mint struck 2014 Native American $1 Coins and 2014 Kennedy halves to the expected amounts needed for the entire year. It continues to produce Presidential dollars to support the four different 2014 releases.
Here is a breakdown for all the circulating-quality coins made by the U.S. Mint in March:
US Mint Circulating Coin Production in March 2014
| Denomination | Denver | Philadelphia | Total |
| Lincoln Cents | 316,000,000 | 295,200,000 | 611,200,000 |
| Jefferson Nickels | 43,920,000 | 48,720,000 | 92,640,000 |
| Roosevelt Dimes | 81,500,000 | 94,500,000 | 176,000,000 |
| 2013 ATB Quarters | 83,400,000 | 53,200,000 | 136,600,000 |
| Kennedy Half Dollars | 0 | 0 | 0 |
| Native American $1s | 0 | 0 | 0 |
| Presidential Dollars | 2,940,000 | 6,020,000 | 8,960,000 |
| Total | 527,760,000 | 497,640,000 | 1,025,400,000 |
U.S. Mint plants in Philadelphia, Pennsylvania and Denver, Colorado manufacture all of the circulating coinage for commerce. In March, the Denver Mint made 527.76 million coins and the Philadelphia Mint struck 497.64 million coins.
First Quarter 2014
The more than 3.4 billion coins minted in the first quarter 2014 is 10.3% higher than the almost 3.1 billion coins produced in the first quarter 2013. Year-to-date coin production splits by U.S. Mint facility stand at 1,806,100,000 coins from Denver and 1,607,720,000 coin from Philadelphia.
This next table offers 2014 coin production totals by denomination and by U.S. Mint facility:
YTD 2014 Circulating Coin Production by Denomination
| 1 ¢ | 5 ¢ | 10 ¢ | 25 ¢ | 50 ¢ | N.A. $1 | Pres $1 | Total: | |
|---|---|---|---|---|---|---|---|---|
| Denver | 1038M | 154.56M | 288M | 305.8M | 2.1M | 5.6M | 12.04M | 1806.1M |
| Philadelphia | 968.4M | 138.96M | 287.5M | 187.4M | 2.5M | 3.08M | 19.88M | 1607.72M |
| Total | 2006.4M | 293.52M | 575.5M | 493.2M | 4.6M | 8.68M | 31.92M | 3413.82M |
This year’s monthly average of nearly 1.138 billion coins sets 2014 on pace for an annual coin production total of more than 13.6 billion coins. In 2013, the U.S. Mint struck just over 11.9 billion coins in circulating quality.
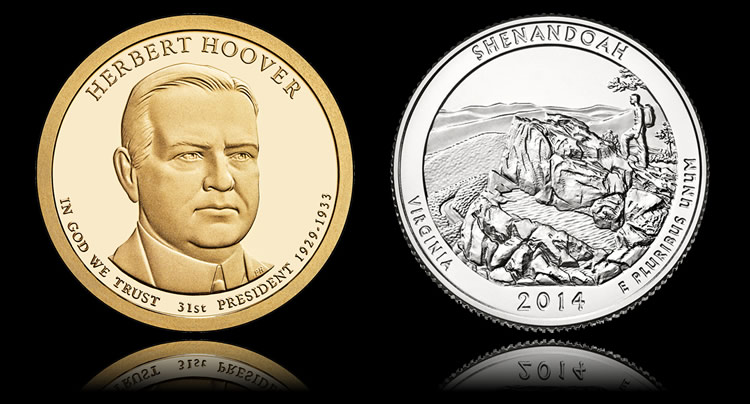
2014 Shenandoah National Park Mintages
Mintages for this year’s second America the Beautiful Quarter, which honors Shenandoah National Park in Virginia, are 197.8 million from Denver and 112.8 million from Philadelphia for a combined total of 310.6 million. That is the 2nd highest total of the twenty-two America the Beautiful Quarters released since the series start in 2010. The only 25-cent piece with a higher total is last year’s Mount Rushmore quarter at 504.2 million.
Shenandoah quarters entered circulation beginning on March 31 and the U.S. Mint is also selling rolls and bags of them.
Hoover $1 Coin Mintages
Herbert Hoover Presidential $1 Coin mintages exactly match Coolidge dollars. The latter $1’s are in the news having just been introduced Thursday in U.S. Mint rolls, bags and boxes. Mintages are 3.78 million from Denver and 4.48 million from Philadelphia for a total of 8.26 million.
Hoover Presidential $1 Coins are scheduled to go on sale June 19. The final dollar design for 2014 depicts Franklin D. Roosevelt, one of the most popular U.S. presidents. There’s a good chance that Roosevelt dollars will have higher mintages to support their upcoming sale in August.
The following table offers a breakdown of mintages by coin design:
2014 Circulating Coin Production / Mintages by Coin Design
| Denver | Philadelphia | 2014 Total | |
| Lincoln Cents | 1,038,000,000 | 968,400,000 | 2,006,400,000 |
| Jefferson Nickels | 154,560,000 | 138,960,000 | 293,520,000 |
| Roosevelt Dimes | 288,000,000 | 287,500,000 | 575,500,000 |
| Great Smoky Mountains Quarter | 99,400,000 | 73,200,000 | 172,600,000 |
| Shenandoah National Park Quarter | 197,800,000 | 112,800,000 | 310,600,000 |
| Arches National Park Quarter | – | – | – |
| Great Sand Dunes Quarter | – | – | – |
| Everglades National Park Quarter | – | – | – |
| Kennedy Half Dollars | 2,100,000 | 2,500,000 | 4,600,000 |
| Native American $1 | 5,600,000 | 3,080,000 | 8,680,000 |
| Warren G. Harding $1 | 3,780,000 | 6,160,000 | 9,940,000 |
| Calvin Coolidge $1 | 3,780,000 | 4,480,000 | 8,260,000 |
| Herbert Hoover $1 | 3,780,000 | 4,480,000 | 8,260,000 |
| Franklin D. Roosevelt $1 | – | – | – |
| Total | 1,795,220,000 | 1,602,800,000 | 3,398,020,000 |
In subtracting the totals by coin design from the overall production figures by denomination, two differences are found:
-
America the Beautiful Quarter mintages are higher by 10.3 million. These are likely Arches National Park Quarters which enter circulation beginning on June 9, 2014.
-
Presidential $1 Coin mintages are higher by 5.46 million. This amount represents over half of the Franklin D. Roosevelt $1’s.
Coin production figures in this coin news article are based on data aggregated from the U.S. Mint webpage at: http://www.usmint.gov/about_the_mint/?action=coin_production.


Interesting data. It seems to confirm my admittedly anecdotal correlation between Mint / BEP output and public perception of the state of the economy. It’s just a shame to see so much effort going into producing cents and dollar bills while halves and dollar coins languish so deeply. But given the fact that Congress gets involved in anything and everything regarding circulating currency I don’t expect that situation will change in my lifetime. Somehow Australia, England, Canada, and the EU (to name a few) have rationalized their coins and bills without causing civilization to collapse, but here we seem frozen… Read more »