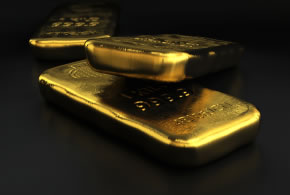
Gold rallied back atop $1,600 an ounce and notched its biggest gain since November as bullish-lined testimony from Fed Chairman Ben Bernanke sparked buying.
More than doubling its previous session performance, gold futures for April delivery settled up $28.90, or 1.8%, to $1,615.50 an ounce on the Comex in New York. Gold last closed above $1,600 an ounce one week ago. Trading occurred between intraday pricing levels of $1,583.70 and $1,619.70.
"Bernanke’s testimonial shows he’s as dovish as ever and he’s leading the show when it comes to asset purchases and easy monetary policy," MarketWatch quoted Jan Skoyles, head of research at The Real Asset Co., a precious-metals investment platform provider.
"He has shown his big concern is over long-term unemployment, and sees more benefits from asset purchases than costs… His concerns over a weak economy can only lead us to one conclusion – that fears over QE finishing early can be assuaged."
Silver followed gold with March futures up 27.3 cents, or 0.9%, to $29.26 an ounce. Silver ranged from an intraday low of $28.55 to a high of $29.43.
Lower on the day, however, were PGM’s.
-
April platinum lost $4.20, or 0.3%, to $1,616.50 an ounce, trading between $1,581.00 and $1,619.20.
- Snapping a two-session winning streak, palladium for March delivery fell $9.65, or 1.3%, to close at $739.40 an ounce. Palladium ranged from a low of $729.10 to a high of $746.60.
London Precious Metals
Precious metals in London were mostly lower as well. In contrasting the Monday PM to Tuesday PM London Fix prices:
- Gold added $4.25, or 0.3%, to $1,590.50 an ounce,
- Silver lost 42.0 cents, or 1.4%, to $28.75 an ounce,
- Platinum declined $15.00, or 0.9%, to $1,605.00 an ounce, and
- Palladium fell $8.00, or 1.1%, to $740.00 an ounce
US Bullion Coin Sales in February
Sales advanced across every type of U.S. Mint bullion product. In totals, sales included 17,500 ounces of gold coins and 349,500 ounces of silver coins. Figures for each U.S. Mint bullion coin follow.
| American Eagle and Buffalo Bullion Coin Sales | |||||
|---|---|---|---|---|---|
| Tuesday Sales | Last Week | Week-To-Date Sales | Feb Sales | YTD Sales | |
| $50 American Eagle Gold Bullion Coins | 13,500 | 14,000 | 13,500 | 65,500 | 190,000 |
| $25 American Eagle Gold Bullion Coins | 1,000 | 2,000 | 1,000 | 5,000 | 22,000 |
| $10 American Eagle Gold Bullion Coins | 2,000 | 6,000 | 2,000 | 12,000 | 36,000 |
| $5 American Eagle Gold Bullion Coins | 5,000 | 35,000 | 5,000 | 70,000 | 180,000 |
| $50 American Buffalo Gold Bullion Coins | 2,500 | 6,000 | 2,500 | 11,500 | 84,000 |
| American Silver Eagle Coins | 337,000 | 903,000 | 822,000 | 3,368,500 | 10,866,500 |
| America the Beautiful 5 Oz. Silver Bullion Coin Sales | |||||
|---|---|---|---|---|---|
| Tuesday Sales | Last Week | Week-To-Date | Feb Sales | All-Time Sales | |
| 2012 El Yunque National Forest 5 oz. Silver Bullion Coins | 0 | 1,600 | 0 | 2,100 | 24,000 |
| 2012 Chaco Culture National Historical Park 5 oz. Silver Bullion Coins | 2,000 | 1,200 | 2,000 | 3,800 | 23,800 |
| 2012 Acadia National Park 5 oz. Silver Bullion Coins | 0 | 0 | 0 | 0 | 25,400 |
| 2012 Hawai’i Volcanoes 5 oz. Silver Bullion Coins | 0 | 0 | 0 | 0 | 20,000 |
| 2012 Denali National Park 5 oz. Silver Bullion Coins | 0 | 0 | 0 | 0 | 20,000 |
| 2011 Olympic National Park 5 oz. Silver Bullion Coins | 0 | 0 | 0 | 0 | 104,900 |
| 2011 Vicksburg National Military Park 5 oz. Silver Bullion Coins | 0 | 0 | 0 | 2,200 | 45,700 |
| 2011 Chickasaw Park 5 oz. Silver Bullion Coins | 500 | 3,800 | 500 | 4,240 | 39,900 |
| TOTAL | 2,500 | 6,600 | 2,500 | 9,840 | 303,700 |
All bullion figures above are in the number of coins sold. Calculate total ounces by using the bullion coin’s weight.


